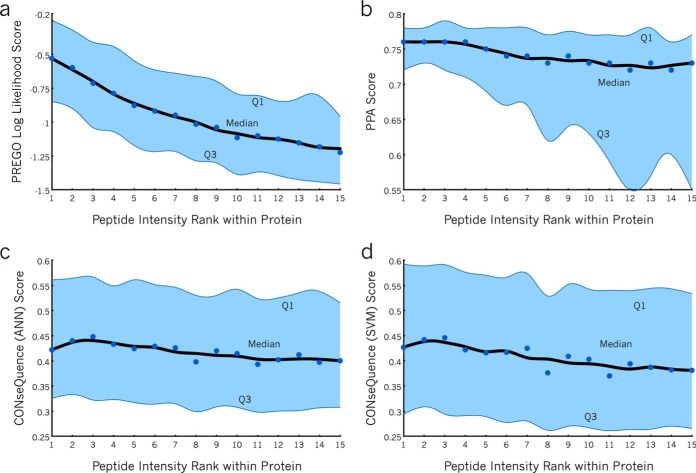
Fig. 4.
Score distributions for four scoring methods by peptide rank. A, The PREGO score distribution for peptides of descending rank across the entire Stergachis et al. SRM testing data set. The median ranks are annotated as dots, where the nearest-neighbor-smoothed trend is plotted as a black line. The interquartile range (Q1 to Q3) is shaded blue. In general, first ranked peptides with the highest responses tend to get higher scores than those of lower ranks, as indicated by the downward trend from left to right. The B, PPA score distribution as well as the CONSeQuence; C, artificial neural network (ANN); and D, support vector machine (SVM) score distributions all show weaker downward trends.

