
Fig. 2.
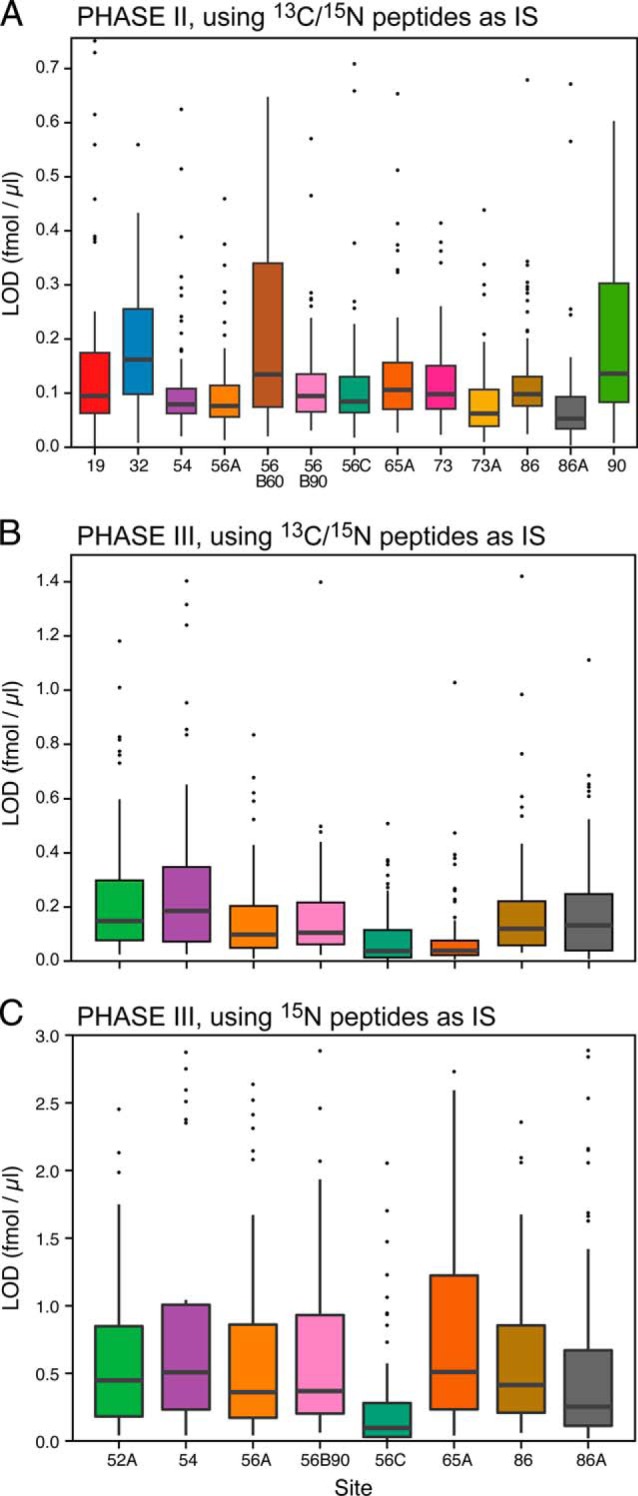
Limit of detection distributions for the peptides monitored at each site. The black bar in each box represents the median peptide LOD at that site, the box represents the interquartile range and the whiskers represents 3x the interquartile range. Outlier peptides are shown as black dots. Panel A represents data from Phase II for the 13 instruments completing the study. Panel B shows the LOD distribution for the eight instruments that completed Phase III, with the synthetic 13C/15N peptides used as internal standards. Panel C represents the same Phase III data, except the U15N-peptides, derived from the U15N-proteins, were used as internal standards.