
Fig. 4.
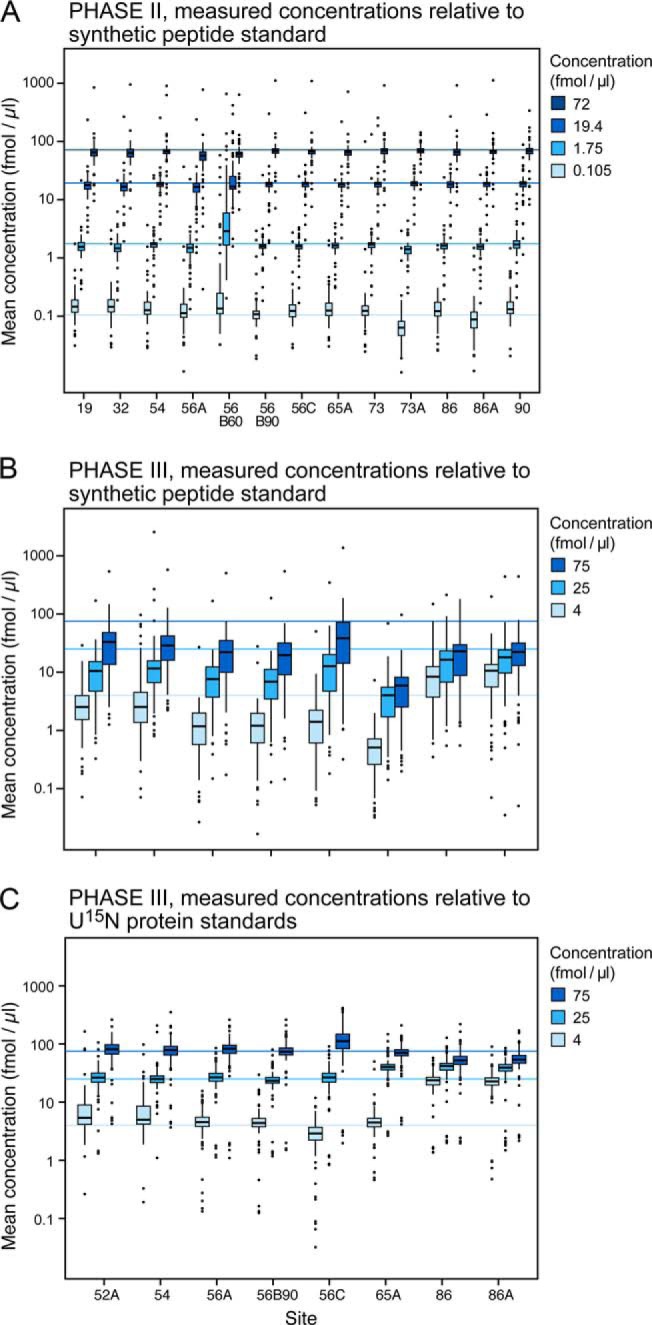
Evaluation of the accuracy of determined concentrations for 125 peptides in the blinded samples. Sets of samples were spiked with peptide (125 peptides in Phase II) and protein (27 proteins in Phase III) analytes at concentrations blinded to the study participants. Blinded samples were analyzed at the sites after each response curve replicate in Phases II and III. Panel A shows the four blinded sample concentrations and the range of peptide concentrations detected at each site in Phase II. Panels B and C represent the Phase III blinded sample concentrations determined when using the 13C/15N peptides (panel B) or the U15N-proteins (panel C) as internal standards. The light blue lines represent the actual concentrations of spiked proteins. Note that in panel B all measured concentrations are well below the actual concentrations when calculating concentration based on spiked heavy peptides. Concentration values are much closer to the actual values in panel C where concentration values were relative to peptides derived from the digestion of U15N-labeled internal standard proteins.