
Fig. 5.
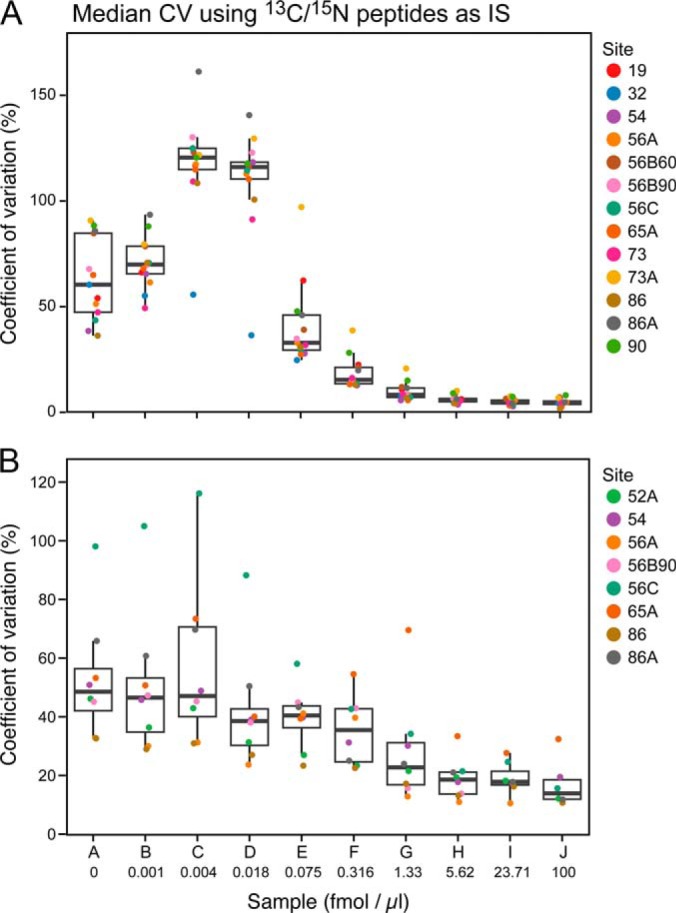
Reproducibility plots for Phases II and III at each sample concentration. The median peak area %CV for 115 peptides is shown for Phase II (panel A) and Phase III (panel B) for all sites.
Official websites use .gov
A
.gov website belongs to an official
government organization in the United States.
Secure .gov websites use HTTPS
A lock (
) or https:// means you've safely
connected to the .gov website. Share sensitive
information only on official, secure websites.
Reproducibility plots for Phases II and III at each sample concentration. The median peak area %CV for 115 peptides is shown for Phase II (panel A) and Phase III (panel B) for all sites.