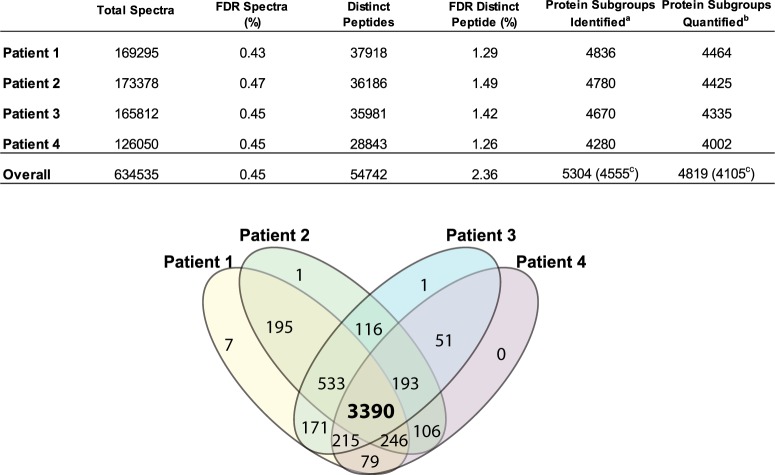
Fig. 2.
Identification summary statistics in the four PMI patient samples. Table enumerates the number of spectra collected, distinct peptides and proteins identified along with the FDR values achieved in four PMI patient samples as reported by Spectrum Mill (see “Methods” for details). Venn diagram shows the overlap of proteins quantified in four PMI patient samples. aProteins identified in at least two patients with two or more peptides. bSubset of identified proteins with two or more distinct peptides observed in at least one patient. cProtein subgroups (groups); that is, 5304 distinct protein subgroups were identified within 4555 protein groups. Proteins that share a detected distinct peptide (length >8) are combined into a group. A protein group is parsimoniously expanded to one or more subgroups to distinguish proteins that also have one or more distinct peptides that are not shared with the rest of the group, typically isoforms and family members.

