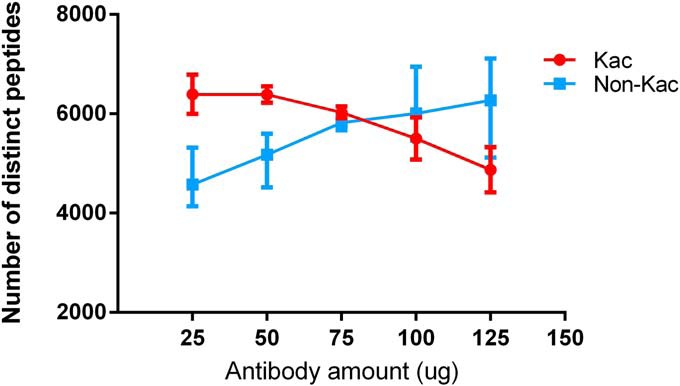
Fig. 2.

Titration curve data for Kac and non-Kac peptides identified after enrichment of 2 mg of peptide input using indicated amounts of anti-Kac antibody (CST). Each data point is the average of three IAP process replicates and error bars represent standard deviation (exception 75 μg point is the average of two replicates).
