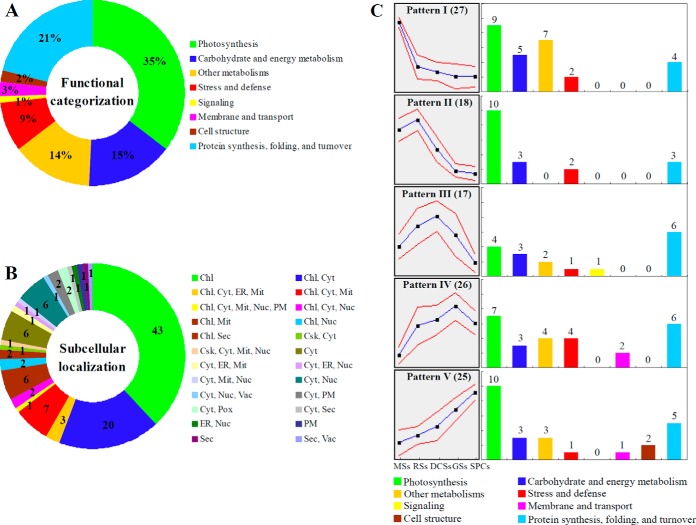
Fig. 6.
Functional categorization, subcellular localization, hierarchical clustering, and functional distribution analyses of differentially expressed proteins (DEPs) during O. cinnamomea L. var. asiatica spore germination. A, A total of 113 proteins were classified into eight functional categories on the bases of BLAST alignments, Gene Ontology, and knowledge from literature. The percentage of proteins in different functional categories is shown in the pie. B, Subcellular localization categories of proteins predicted by internet tools. The numbers of proteins with different locations are shown. C, Hierarchical clustering and functional distribution analyses of DEPs. Self-organizing maps clustering analysis of the protein expression profiles was performed based on the standardization of each protein abundance data using GeneCluster software (version 2.0). The blue line shows normalized level of protein expression in each group and the red line represents the variation of protein expression in the left panel. The columns with different colors in the right panel show the protein functional categories, and the protein numbers in each category are labeled on the top of corresponding columns. Chl, chloroplast; Csk, cytoskeleton; Cyt, cytoplasm; DCSs, double-celled spores; ER, endoplasmic reticulum; GSs, germinated spores; Mit, mitochondria; MSs, mature spores; Nuc, nucleus; PM, plasma membrane; Pox, peroxisome; RSs, rehydrated spores; Sec, secreted; SPCs, spores with protonemal cells; Vac, vacuole.

