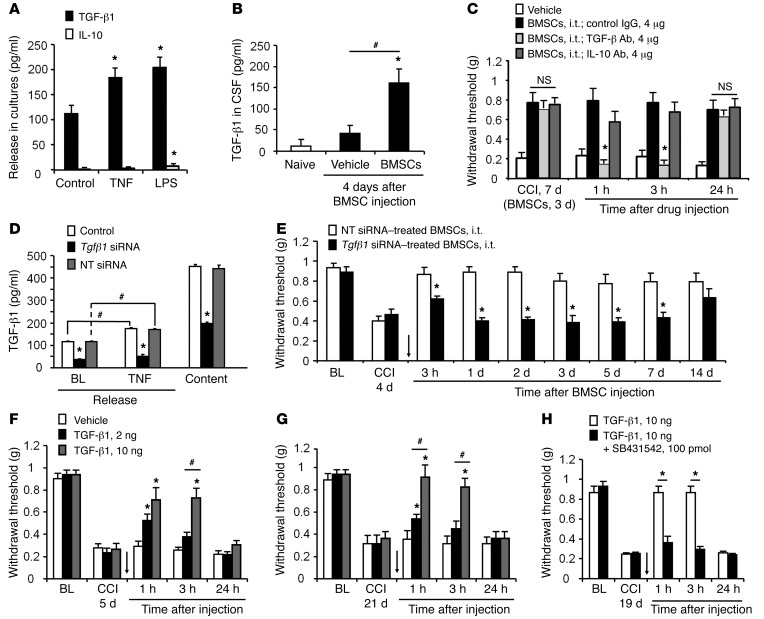
Figure 5. BMSCs release TGF-β1 to inhibit neuropathic pain in CCI mice.
(A) ELISA analysis showing TGF-β1 and IL-10 release in BMSC culture medium and the effects of TNF (10 ng/ml, 60 min) and LPS (100 ng/ml, 60 min) on the release. *P < 0.05, compared with the respective control group; n = 8 separate cultures from different mice. (B) ELISA analysis showing increased TGF-β1 release in CSF 8 days after CCI and 4 days after i.t. delivery of 2.5 × 10⁵ BMSCs. *P < 0.05, compared with naive and vehicle-treated cells; #P < 0.05; n = 4 mice/group. (C) Reversal of BMSC-induced inhibition of mechanical allodynia by TGF-β1–neutralizing Abs (4 μg, i.t.), but not by IL-10–neutralizing Abs (4 μg, i.t.) or control IgG (4 μg, i.t.). *P < 0.05, compared with the control IgG group; n = 5 mice/group. (D) Reduction of TGF-β1 release and expression in BMSCs following Tgfb1 siRNA treatment (1 μg/ml for 18 h). Both baseline release and evoked release by TNF (10 ng/ml, 1 h) were measured. *P < 0.05, compared with nontargeting siRNA; #P < 0.05; n = 4 separate cultures from different mice. (E) Antiallodynic effect of BMSCs (2.5 × 10⁵ cells) was compromised by pretreatment of BMSCs with Tgfb1 siRNA (1 μg/ml for 18 h), but not with nontargeting control siRNA. Arrow indicates the time of the BMSC injection. *P < 0.05, compared with nontargeting siRNA control. n = 5 mice/group. (F and G) Dose-dependent reversal of mechanical allodynia by i.t. TGF-β1 at 5 and 21 days after CCI. Arrows in F and G indicate the time of the BMSC injection. *P < 0.05, compared with the vehicle group; #P < 0.05; n = 5 mice/group. (H) TGF-βR1 inhibitor SB431542 (100 pmol, i.t.) completely blocked the antiallodynic effect of TGF-β1 (10 ng, i.t.). Arrow indicates the time of i.t. injection given 19 days after CCI. *P < 0.05; n = 4–5 mice/group. Statistical significance was determined by 1-way ANOVA (A, B, and D), 2-way ANOVA, followed by Bonferroni’s post-hoc test (C, E, and F–H), or Student’s t test (E and H). All data are expressed as the mean ± SEM. NT, nontargeting.

