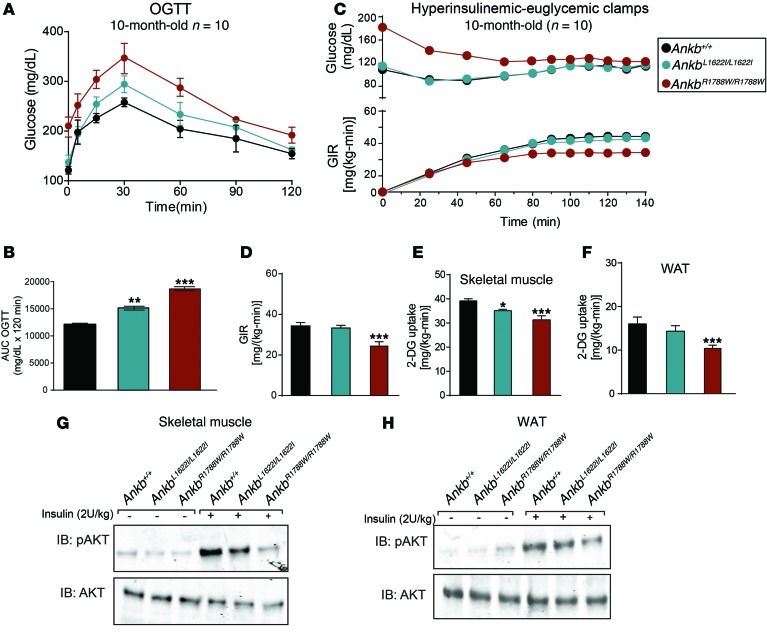
Figure 8. Age-dependent changes in glucose levels and insulin sensitivity in AnkbR1788W/R1788W mice.
(A) Blood glucose levels in response to oral glucose (2 mg/kg body weight). (B) Area under the curve for the OGTT. (C) Hyperinsulinemic-euglycemic clamp analysis in 10-month-old mice (n = 10). (D) GIR during insulin clamp. (E and F) 2-DG uptake by (E) skeletal muscle and (F) WAT. (G and H) Immunoblots of total AKT and phosphorylated AKT (p-AKT S473) levels in (G) skeletal muscle and (H) WAT from 10-month-old mice (n = 6 mice) under basal or insulin-stimulated conditions. Data from G and H are representative of 3 independent experiments. All data represent mean ± SEM. *P < 0.05, **P < 0.01, ***P < 0.001, 1-way ANOVA with post-hoc Tukey test.

