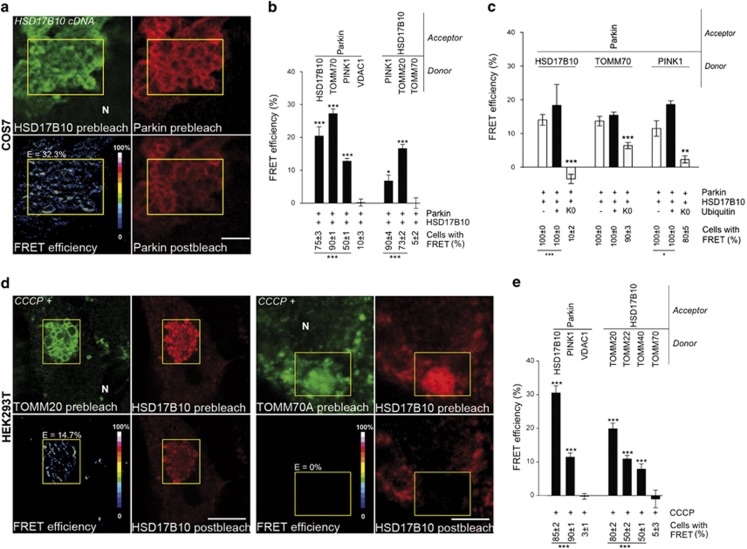
Figure 4.
Parkin interacts with HSD17B10 and PINK1 at the TOM machinery. (a) Representative FRET images for the indicated donor (green)–acceptor (red) pairs in COS7 cells overproducing Parkin and HSD17B10, Pseudocolor scale: pixel-by-pixel FRET efficiencies reflecting the increase in donor fluorescence after photobleaching of the acceptor. (b, c) Quantitative FRET analysis and percentage of cells displaying FRET for all donor–acceptor pairs analyzed in the indicated conditions. n=10–20 cells from one experiment representative of three (b) or two (c) carried out. (d, e) Representative FRET images (d) and quantitative FRET analysis for the indicated donor/acceptor pairs (e) in HEK293T cells treated with CCCP for 6 h. n=10–20 cells from one experiment representative of three carried out. E: Mean FRET efficiency within the region of interest (yellow, ROI). N: nucleus. Scale bar: 10 μm. Results are expressed as means±S.E.M. *P<0.05, **P<0.01, ***P<0.001 versus VDAC1/Parkin for donor/Parkin pairs and TOMM70/HSD17B10 for donor/HSD17B10 pairs in (b, e), or versus ‘−Ubiquitin' and ‘+Ubiquitin' in (c)

