Figure 7.
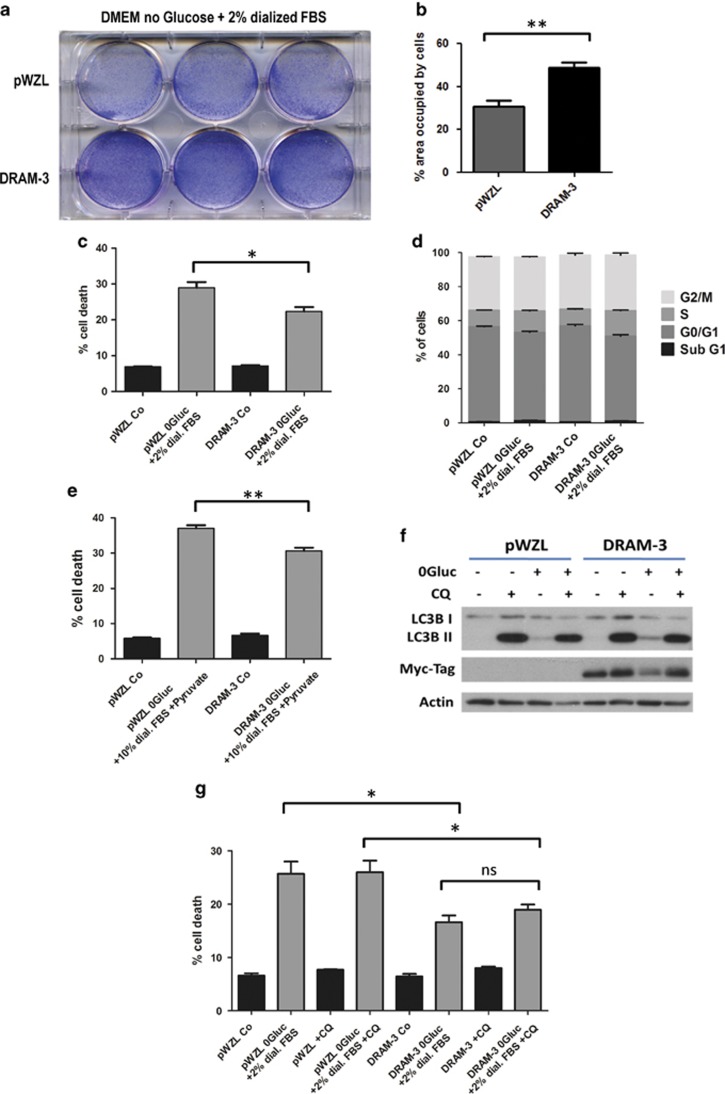
DRAM-3 promotes survival after glucose starvation. (a) DRAM-3 overexpression improves clonogenic survival after glucose starvation. Saos-2 cells stably overexpressing DRAM-3 or a control construct (pWZL) were subjected to DMEM no glucose media +2% dialyzed FBS. After 24 h the starvation media was exchanged with growth media and cells were left recovering for 2–3 days before they were stained with Giemsa. (b) Quantification of (a). Three experiments were quantified for the percentage of the area occupied by cells. A paired Student's t-test was performed as statistical analysis, and the bars in the figure represent mean values; errors are S.E.M. **P<0.01. (c) DRAM-3 overexpression prevents cell death after glucose starvation. Saos-2 cells stably overexpressing DRAM-3 or a control construct (pWZL) were subjected to DMEM no glucose media +2% dialyzed FBS. After 24 h the cells were collected and incubated with propidium iodide (PI; 5 μg/ml) for 30 min and then analyzed for PI uptake on a FACS Calibur. Results from five experiments measured in triplicates, displayed as mean; error bars are S.E.M. Statistical analysis was performed using a Student's t-test. *P<0.05 (d) Cell death after glucose starvation does not involve DNA fragmentation in Saos-2 cells. Saos-2 cells stably overexpressing DRAM-3 or a control construct (pWZL) were subjected to DMEM no glucose media +2% dialyzed FBS. After 24 h the cells were collected, fixed and subjected to cell cycle profile analysis. The sub-G1 fraction indicates DNA fragmentation – a marker of apoptosis. Results from three experiments measured in triplicates. (e) Addition of 10% dialyzed serum and sodium pyruvate does not affect the effect of DRAM-3 on glucose starvation-induced cell death. Saos-2 cells stably overexpressing DRAM-3 or a control construct (pWZL) were subjected to DMEM no glucose media +10% dialyzed FBS +0.11 g/l sodium pyruvate. After 48 h the cells were collected and incubated with Propidium Iodide (5 μg/ml) for 30 min and then analyzed for PI uptake on a FACS Calibur. Results from three experiments measured in triplicates, displayed as mean; error bars are S.E.M. Statistical analysis was performed using a Student's t-test. **P<0.01 (f) Addition of chloroquine to glucose starvation medium blocks autophagic flux. Ten micromolars of chloroquine was added to full DMEM or glucose-free medium supplemented with 2% dialyzed FBS to block the turnover of autophagosomes. Protein samples were collected after 24 h and processed for western blotting. (g) Autophagy block with chloroquine does not abolish the effect of DRAM-3 overexpression under glucose-starved conditions. Cells were collected for PI exclusion FACS analysis after 24 h. The data displayed are from four independent experiments and are presented as mean; error bars are S.E.M. A Student's t-test was performed for statistical analysis. *P<0.05; NSP>0.05

