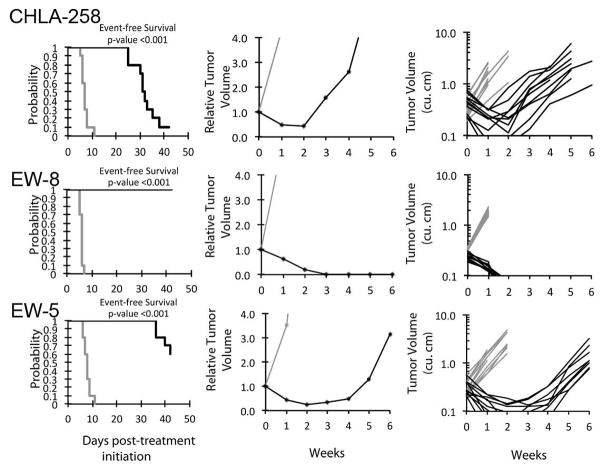
Figure 1.
Nab-paclitaxel in vivo objective response activity for Ewing sarcoma models having high Caveolin-1 expression. Ewing sarcomas (CHLA-258, EW-8, and EW-5): Kaplan-Meier curves for EFS (left), median relative tumor volume graphs (center), and individual tumor volume graphs (right) are shown for selected lines. Controls (gray lines); Treated (black lines), statistical significance (p values) of the difference between treated and control groups are included.

