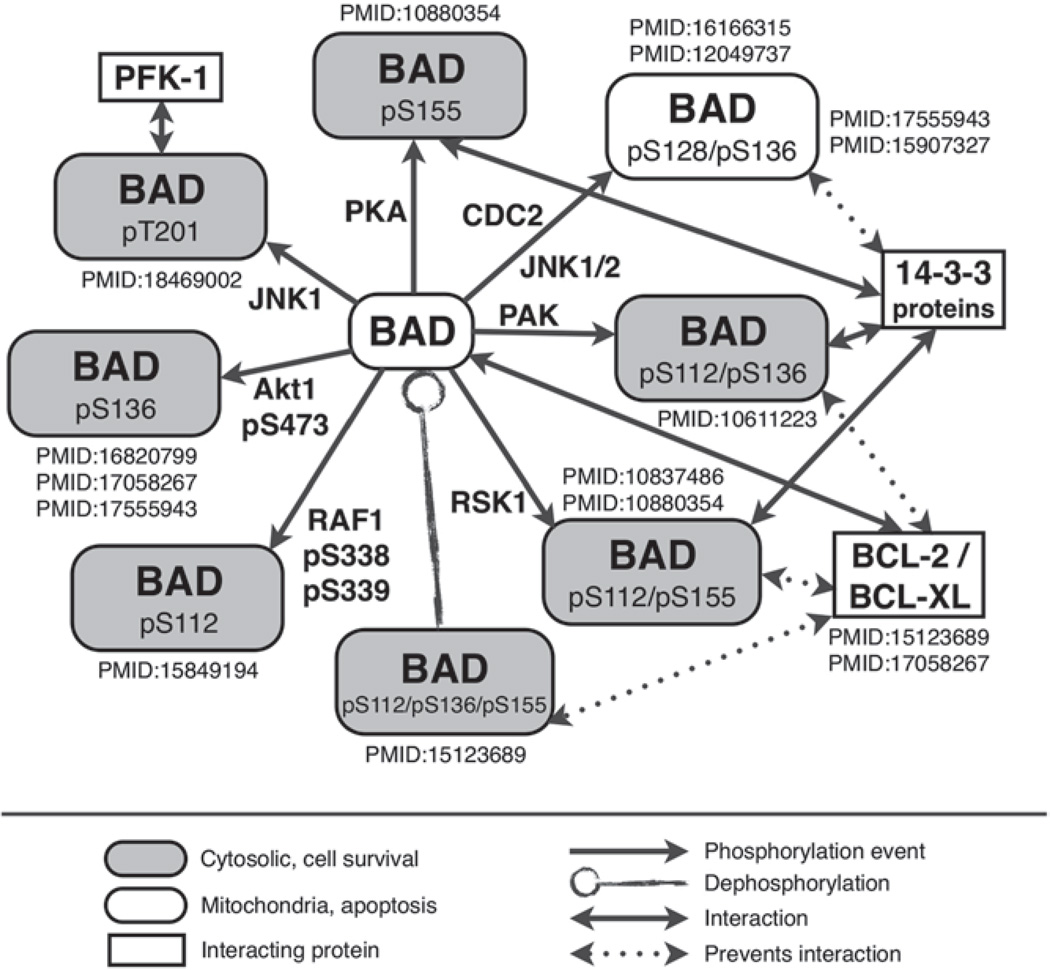
Fig. 6.
Representation of different forms of phosphorylated BAD based on eFIP’s results (only a subset is shown). Note that from information listed by eFIP, we are able to represent the impact (cytosolic vs. mitochondria; apoptosis vs. cell survival) for the different forms of BAD. Moreover, the kinases, which accompany the phosphorylation arrows, help to link BAD to pathways. Whenever available, the phosphorylation state of the kinase is extracted and displayed here, as in the case of RAF1 p338/pS339.

