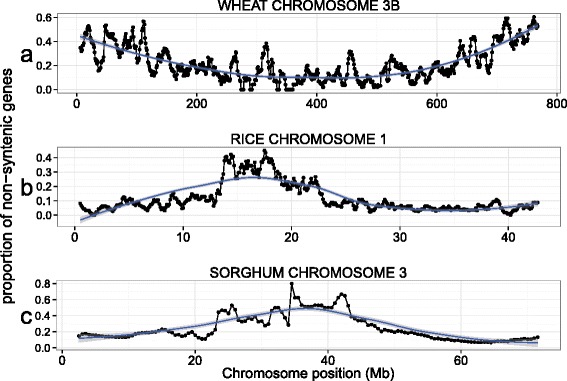
Fig. 3.

Chromosomal distributions of non-syntenic genes. Proportion of non-syntenic genes per total number of genes for (a) wheat chromosome 3B, (b) rice chromosome 1, and (c) sorghum chromosome 3. For wheat, the proportion of non-syntenic genes per total gene count was plotted in a sliding window of 10 Mb with a step of 1 Mb; in rice, 1 Mb sliding window with a step of 0.1 Mb, and for sorghum a 5 Mb sliding window with a step of 0.5 Mb. Pseudogenes were removed
