
Fig. 3.
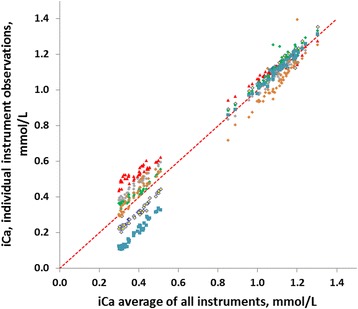
Systemic and post filter measurements of ionized calcium (iCa) concentrations. Regressions are between results from individual instruments and the average of all results of a particular sample. The maximum difference in the post filter group was found between the Prime (red triangles) and the Cobas b 123 (blue squares). The other instruments are (top to bottom, diamonds) the pHOx (gray), ABL90 (green), Rapid (light brown) and Gem4000 (yellow and black border). Red dotted line is the equal line. The relative maximum difference in the systematic result group was miniscule and the individual observations indistinguishable at the present resolution