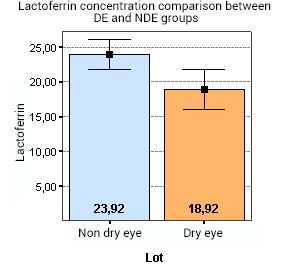
Fig. 4.

Shows that there is a statistically significant difference between lactoferrin concentration in the DE and NDE groups (p < 0.001). As it follows, in the DE group, a mean lactoferrin level of 18,92% was found, compared to 23,92% in the NDE group
