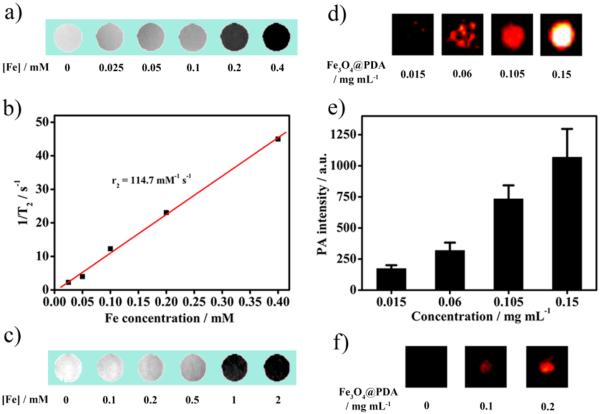
Figure 4.
(a) T2-weighted MR images of the Fe3O4@PDA NCs in aqueous solution at different Fe concentrations. (b) Corresponding T2 relaxation rate of the Fe3O4@PDA NCs as a function of Fe concentration. (c) T2-weighted MR images of MCF-7 cells (5 × 10⁵) incubated with the Fe3O4@PDA NCs at different Fe concentrations. (d) PA images and (e) corresponding PA intensity of the Fe3O4@PDA NCs with different concentrations. (f) PA images of MCF-7 cells (5 105) incubated with different concentrations of Fe3O4@PDA NCs.

