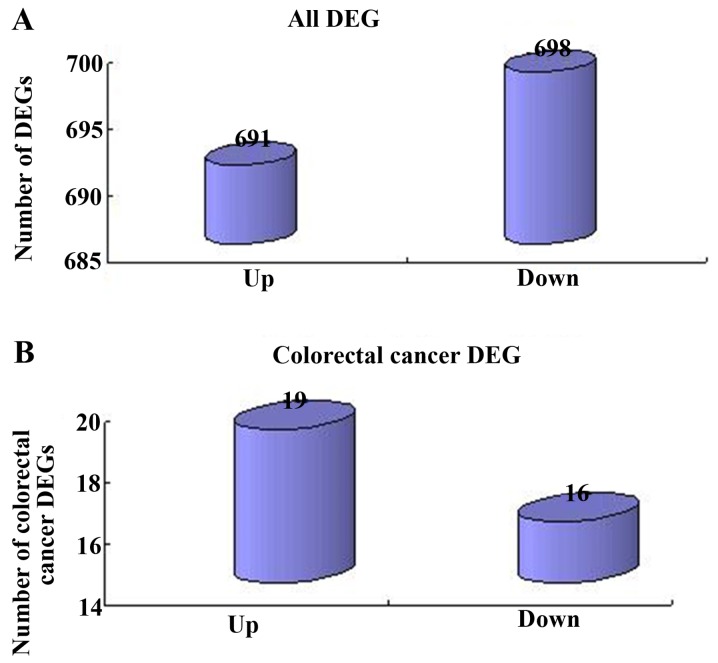
Figure 3.
Identification of critical genes. (A) Analysis of the DEGs identified between the CRC and normal samples. Horizontal axis, alterations of gene expression; vertical axis, number of genes. (B) Analysis of the 35 identified CRC genes. Horizontal axis, alterations of gene expression; vertical axis, number of genes. DEGs, differentially expressed genes. MF, molecular function; BP, biological process; CC. cellular component.

