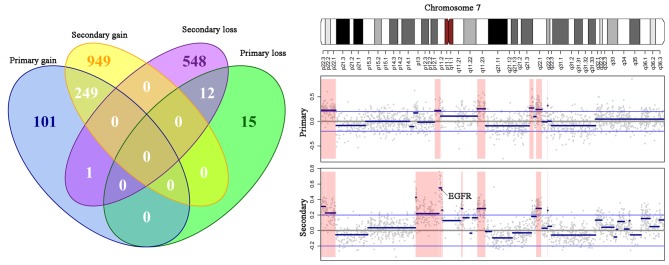
Figure 2.

Gene comparison in DNA copy number variation regions. (A) Venn diagram presenting gene numbers of different gene sets derived from the gain/loss regions of the primary/secondary tumors. (B) DNA copy number alteration patterns for chromosome 7. The upper panel presents the cytogenetic bands of chromosome 7. The middle and lower panels indicate the CNV data of the primary and secondary tumors, respectively. For the CNV data, the x-axis indicates the genomic positions, y-axis indicates the log10 ratio value, grey dots indicate the raw value of each microarray probe, blue thick indicates the DNA segments detected by the circular binary segmentation algorithm, blue thin lines indicate the cut-off 0.2, and red shadows indicate the DNA regions with altered copy numbers. CNV, copy number variations.
