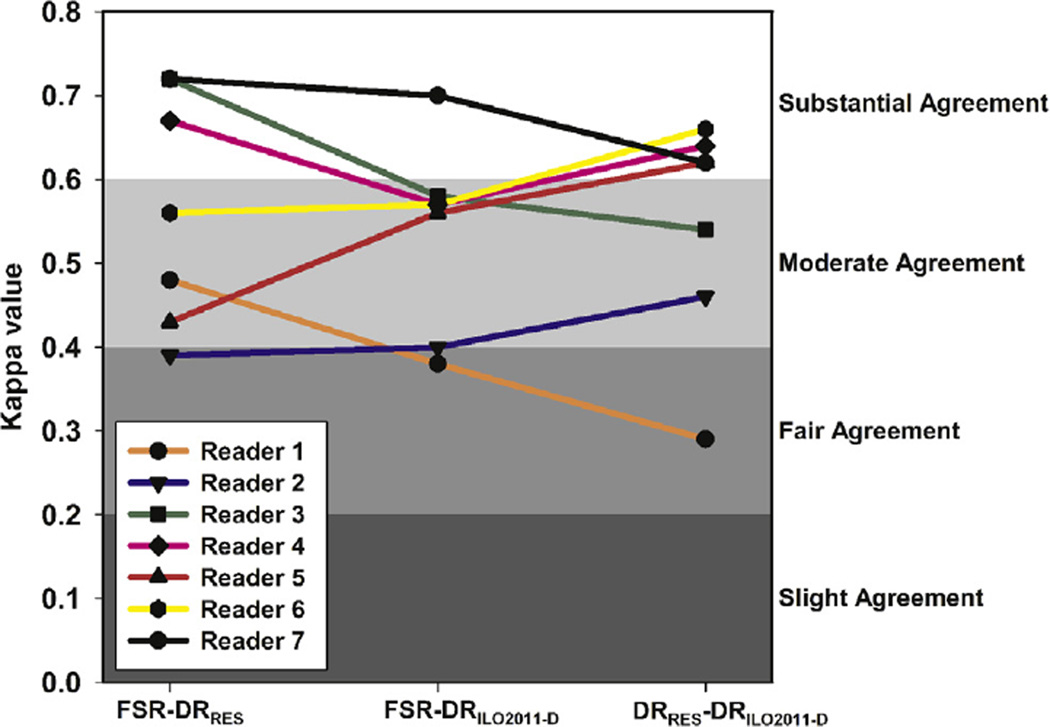
Figure 2.
Intrareader variability of small opacity profusion from this study and from the values previously reported by Laney et al. (FSR-DRRES) (6) is presented using weighted κ values for classification method comparisons. Background shading represents κ value interpretation scale, darker shading signifies decreases in agreement: κ = 0.01–0.20 slight agreement, 0.21–0.40 fair agreement, 0.41–0.60 moderate agreement, and 0.61–0.80 substantial agreement (7). Not shown: κ < 0 less than chance agreement and κ = 0.81–0.99 almost perfect agreement. DRRES, digital radiograph interpreted using the “research” digitized standards; DRILO2011-D, digital radiograph interpreted using digitized ILO reference standards (2011-D); FSR, film-screen radiograph interpreted using 2000 ILO film-based reference standard.

