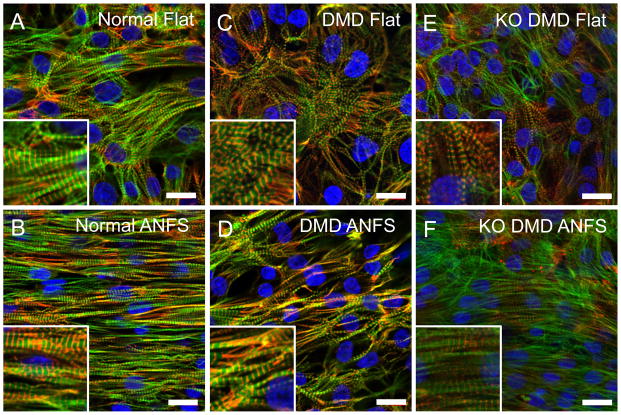
Figure 4.
Immunofluorescent confocal images of sarcomere structure in normal (A and B), patient-derived DMD (C and D), and KO DMD hiPSC-CMs (E and F) on flat or ANFS after two weeks of culture. Cells have highly aligned cytoskeletal and sarcomere structures on ANFS compared to flat substrata, but DMD hiPSC-CMs show less alignment than normal hiPSC-CMs. Insets show close-ups of striated sarcomeres. Green = F-actin, Red = α-actinin, Blue = DAPI. Scale bar: 20μm.

