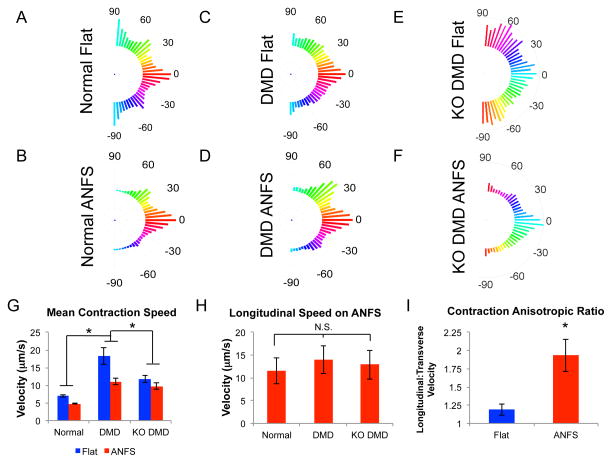
Figure 7.
Correlation-based Contraction Quantification (CCQ) analysis of beating monolayers. (A-F) Average contraction angle histograms of normal (A and B), patient-derived DMD (C and D), and KO DMD hiPSC-CMs (E and F) on flat and ANFS. Patient-derived DMD hiPSC-CMs have more random contraction angles on ANFS than normal hiPSC-CMs. (G) Maximum contraction speeds of normal, patient-derived DMD, and KO DMD hiPSC-CMs. In general, DMD hiPSC-CMs have faster contraction speeds than normal hiPSC-CMs (*p < 0.05). (H) Isolated longitudinal contraction velocities in the direction of cell alignment and nanotopography show no significant difference between groups (p = 0.65). (I) Contraction velocity anisotropic ratio (Longitudinal:Transverse Velocity) of normal hiPSC-CMs on flat and ANFS. Normal hiPSC-CMs are highly functionally anisotropic on ANFS. These results, together with the contraction angle histograms, suggest there is greater variability in the DMD hiPSC-CM contractile directions, leading to the larger overall contraction speeds in (G).

