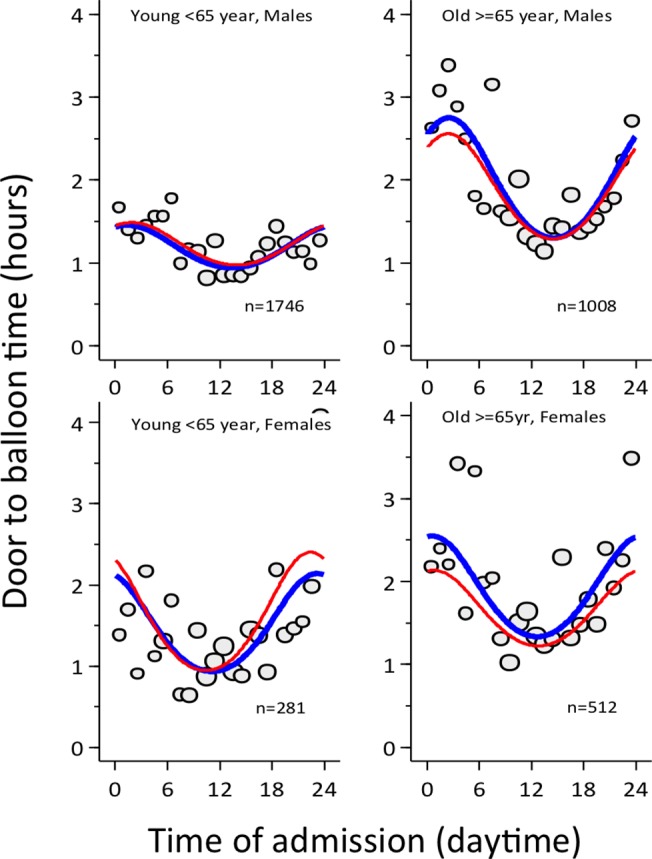
Fig 4. Circadian pattern of door to balloon times in women and men <65 years and ≥65 years.

The x-axis shows the clock-time of hospital admission, the y-axis shows the door-to-balloon time. The red line shows the crude, the blue line the adjusted estimate.
