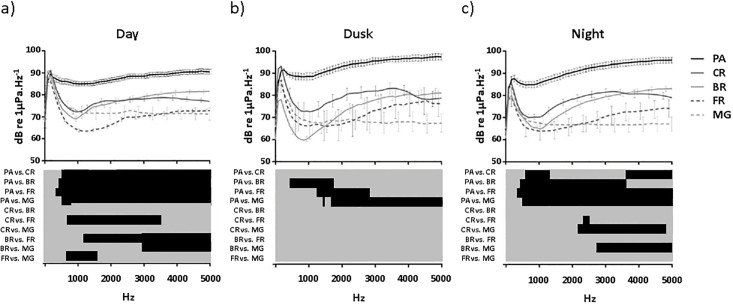
Fig 3. Average power spectra for the five habitats recorded at the North Coast in 2011.
Recordings were performed during the day (a), at dusk (b) and at night (c). CR = inner reef crest; BR = barrier reef; PA = pass; FR = fringing reef and MG = mangrove forest. Values are mean ± SE for the 20 to 5000 Hz frequency range. Error bars are not shown for each frequency point for CR, BR, FR and MG but are staggered along the spectra lines in order to avoid overlapping lines and ensure greater clarity in their visualisation. All error bars are displayed for PA. Bottom: significant differences between habitats (multiple comparison post-hoc test); black = P < 0.05. Grey = non-significant difference.

