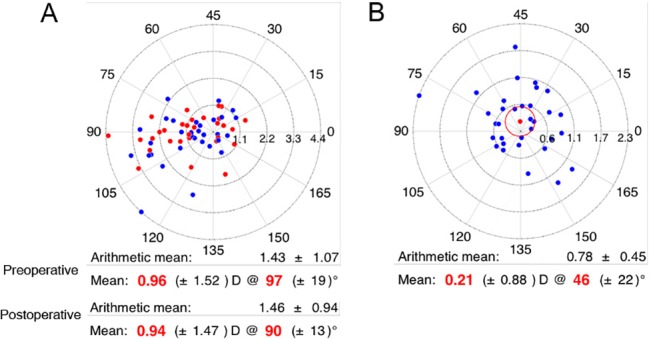
Fig 2. Scatter plots using Astig PLOT.

A. Scatter plot of polar astigmatic vectors for preoperative (blue dots) and postoperative (red dots) astigmatism (n = 33). B. Scatter plot of calculated surgically induced astigmatism (SIA) using the mean corneal astigmatism in the 3-mm zone obtained with the Orbscan II (n = 33).
