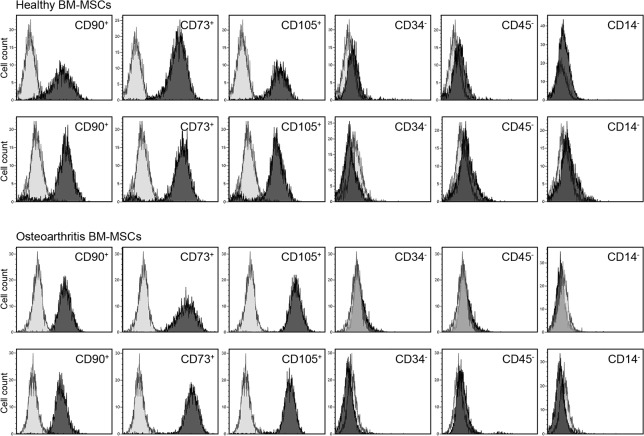
Fig 1. Characterization of MSCs by Flow Citometry.
Representative flow Cytometry analysis of MSCs obtained from healthy subjects and OA Patients. MSCs at third passage were positive for MSC specific markers (CD90, CD73, CD105 and negative for CD34, CD45 and CD14). Figure represents an overlayed image of antibody isotype controls (light gray histogram) and specific marker antibodies (dark gray histogram). Healthy MSCs and OA-MSCs did not exhibit quantitative difference in terms of expression of these individual markers.

