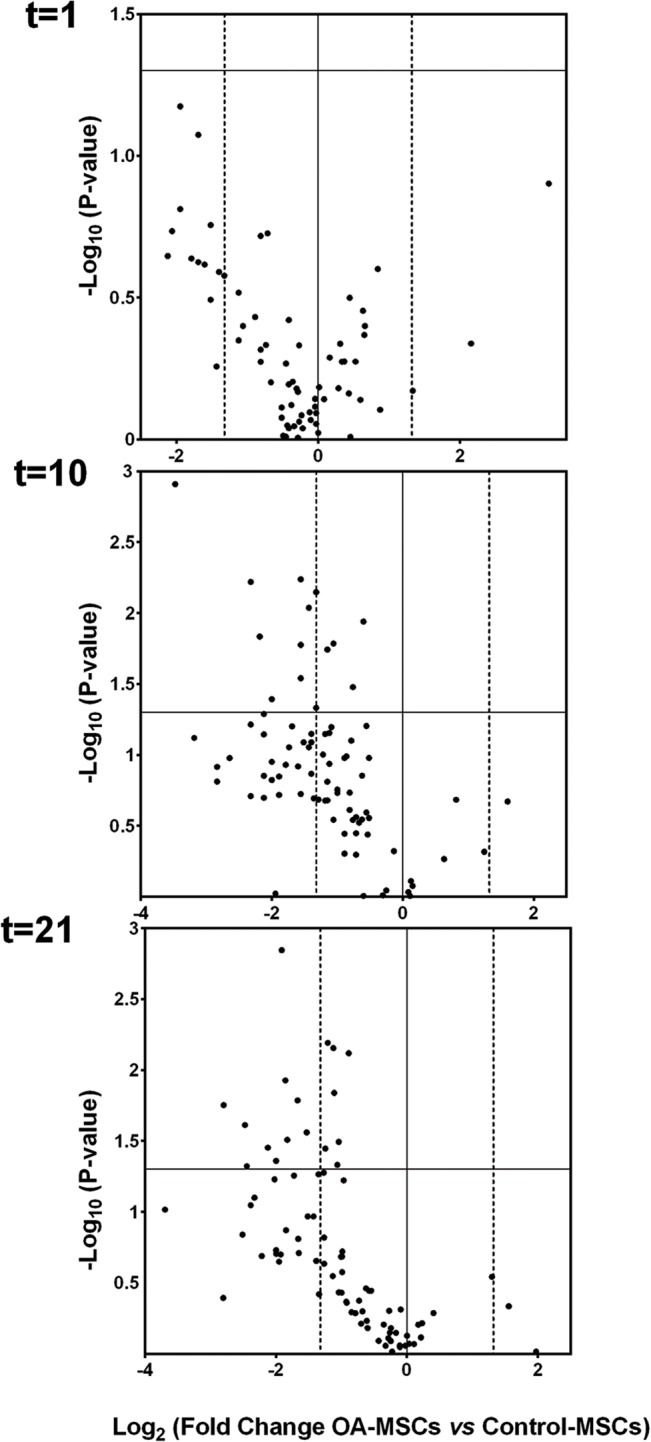
Fig 3. In vitro potential of differentiation of Healthy and OA-MSCs.

Volcano plots representing the differential fold regulation in OA-MSCs compared to Healthy-MSCs at t = 1, 10 and 21 days of osteogenic differentiation. 84 WNT signaling pathway related genes analyzed in our study are represented. Vertical dashed lines indicate the 2.5-fold regulation cutoff. Significative genes with fold change <-2.5 and p-values <0.05 were seen only at days 10 and 21 and are indicated in S2 Table.
