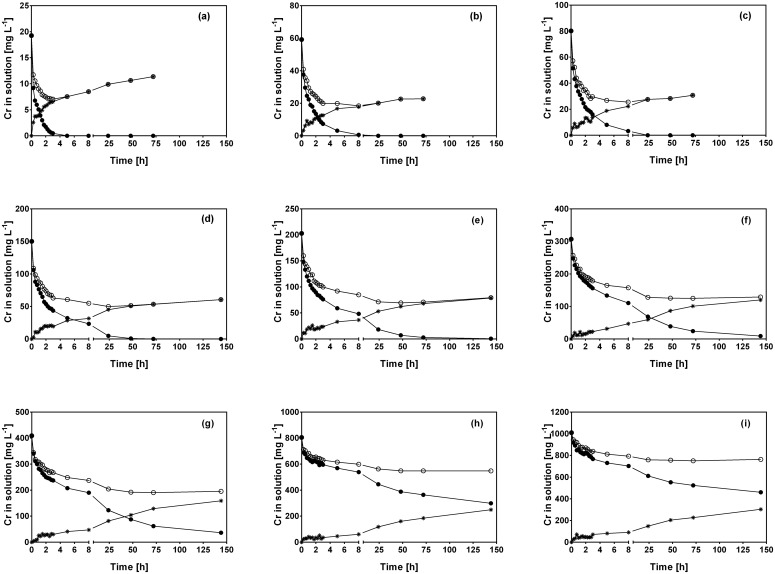
Fig 2. Variations of Cr(VI) (●), total Cr (○) and Cr(III) (✳) concentration with respect to contact time at different initial Cr(VI) concentrations.
[Concentration (mg L-1): (a) 20, (b) 60, (c) 80, (d) 150, (e) 200, (f) 300, (g) 400, (h) 800, (i) 1000]. CLB concentration: 1 g L-1; pH = 1.5±0.1; temperature = 28±2°C.

