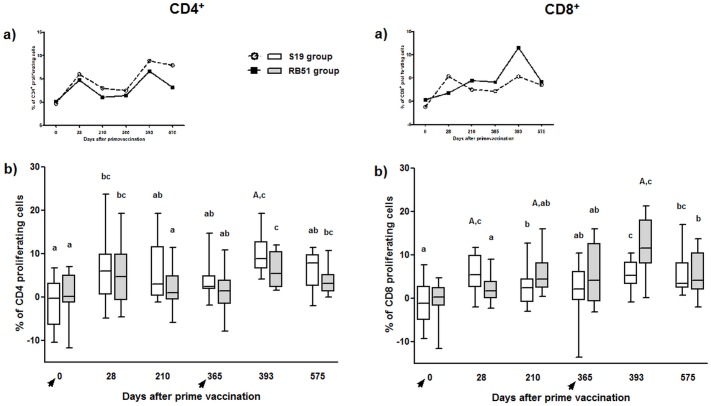
Fig 3. CFSE proliferation analysis of CD4+ and CD8+ T-cells subsets in peripheral blood mononuclear cells of S19 and RB51 prime vaccinated, and RB51 revaccinated cattle upon in vitro stimulation with ɣ-irradiated B. abortus 2308.
Tendency (median) (a) and box plot (median, first and third quartiles) (b) charts of the results. Whiskers show the lower and upper 1.5 interquartile range. Vaccinations were indicated by arrows. Significant differences (P < 0.05) between vaccination regimens (on same day) are indicated by uppercase letters (Mann-Whitney-test), and lowercase letters indicate statistical differences between days in same group (Skillings Mack test followed by Wilcoxon signed rank test).

