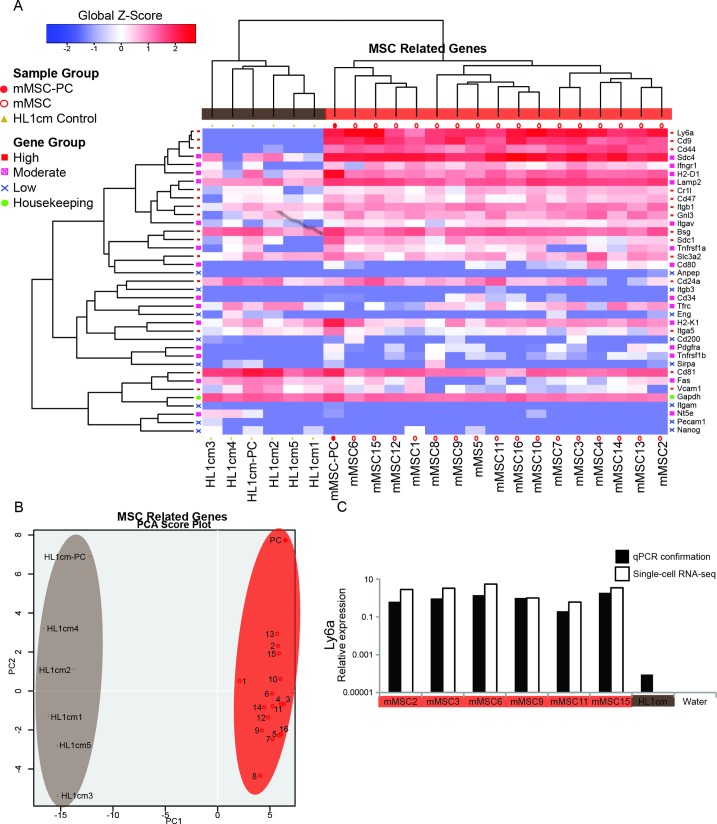
Fig 1. Single-cell mMSCs express genes associated with MSC multipotency.
(A) Hierarchal clustering (HC) of mMSCs for a set of genes related to MSC multipotency. Genes are organized either by genes expressed highly in mMSCs (red), genes expressed moderately/heterogeneously in mMSCs (pink), genes that are lowly expressed in mMSCs (blue) or housekeeping genes (green). Global Z-Score reflects the number of standard deviations away from the mean of expression in the reference. (B) Principal component analysis (PCA) analysis of single cell mMSCs (1–16) (red), negative control single cells (HL1cm1-HL1cm5) (brown), and population controls (PC and HL1cmPC). (C) Quantitative reverse transcriptase polymerase chain reaction (qPCR) confirmation of RNA-seq data.

