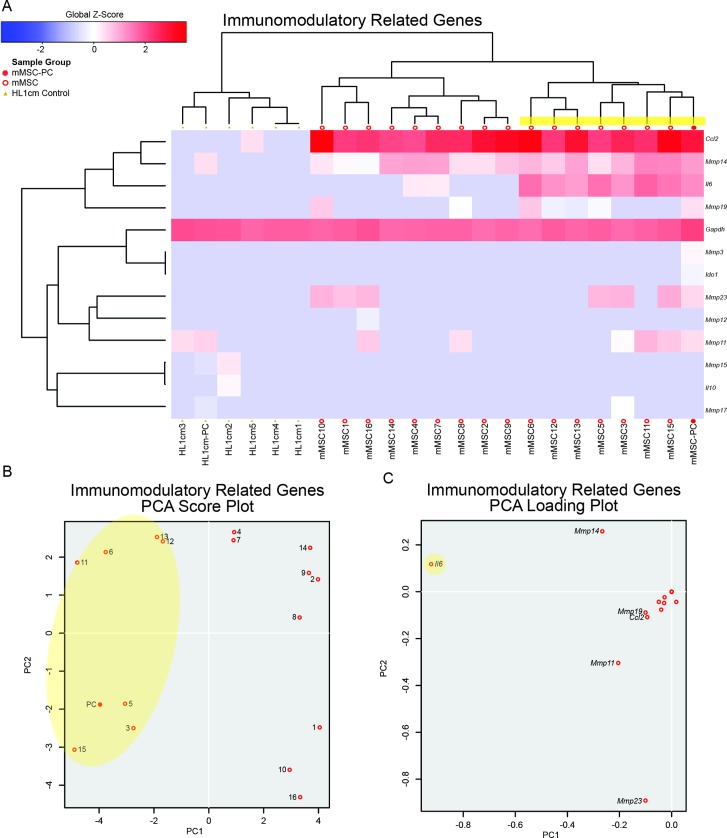
Fig 3. Single cell mMSCs exhibit minimal but measureable differences in expression of immunomodulatory genes.
(A) HC of single cell mMSCs, negative control single cells (HL1cm1-5), and population controls (mMSC-PC and HL1cmPC) for a set of genes related to immunomodulatory function. (B) PCA analysis of single cell mMSCs (1–16) and population control (PC). (C) PCA loading plot showing individual differentiation genes represented in (B). Il6 expressing cells clustered together (yellow).

