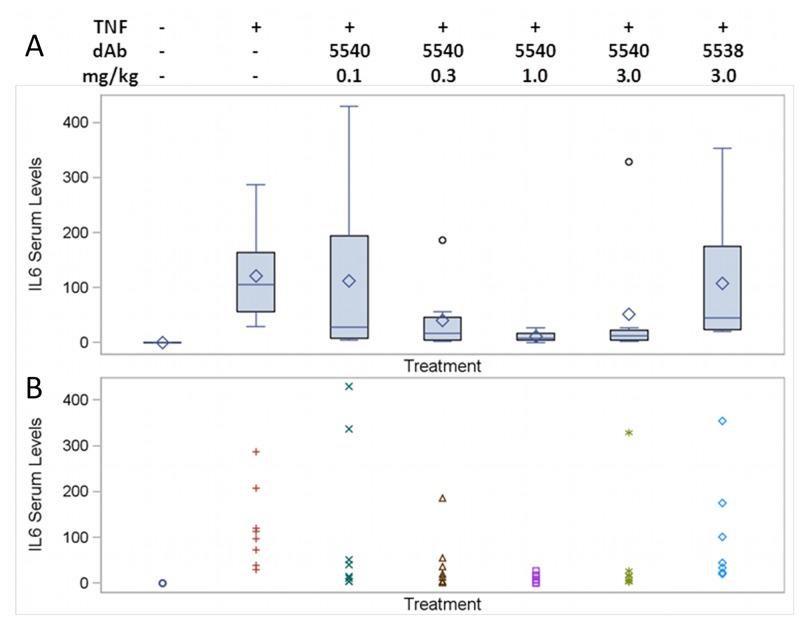
Fig 5. DMS5540 PD determined by protection provided to IL-6 serum increases after in vivo TNF-α challenge.
Eight mice per dose group were injected with DMS5540, DMS5538 (Dummy control) or nothing at the indicated dose in mg/kg. Four hours later all mice indicated received a bolus injection of mouse TNF-α (100 ng/mouse) and 2 hours later serum samples were taken to determine IL-6 levels. (A) Boxplot for IL-6 serum level (pg/ml) for each dose group. Boxplot description: the horizontal line is the median and the diamond is the mean. The upper and lower ends of the box are located at the upper quartile (Q3) and lower quartile (Q1) respectively. The whiskers show the minimum observation before 1.5 x IQR below the box and the maximum observation before 1.5 x IQR above the box. Observations beyond the error bars are shown as individual data points. (B) Individual mouse IL-6 serum levels (pg/ml) for all 8 mice in each dose group.

