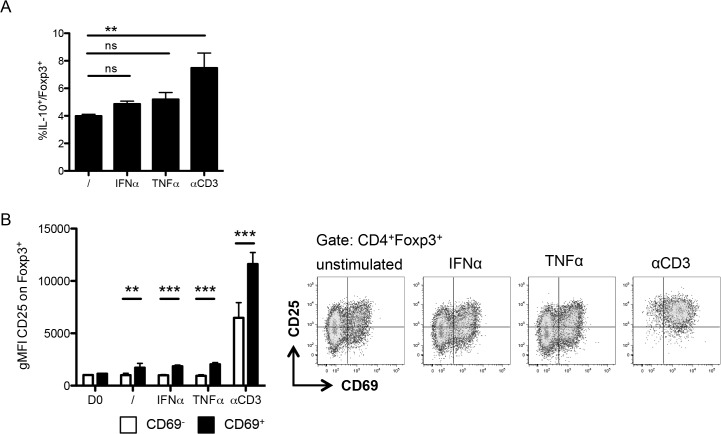
Fig 5. IL-10 and CD25 expression by cytokine-activated CD69+ Treg.
(A) Frequency of IL-10+ cells by IL-10 intracellular staining on Foxp3+ among enriched CD4+ T cells stimulated overnight without additional cytokines (/), with IFN-α, TNF-α, or plate-bound αCD3. (B) Expression of CD25 by geometric mean fluorescence on CD69+ (black bars) and CD69- (white bars) (left) and representative plots (right) of Foxp3+ among enriched CD4+ T cells stimulated as in (A). Data show mean + SD, **p ≤ 0.01, *** p ≤ 0.001; ns, non significant. Data are representative of two independent experiments.

