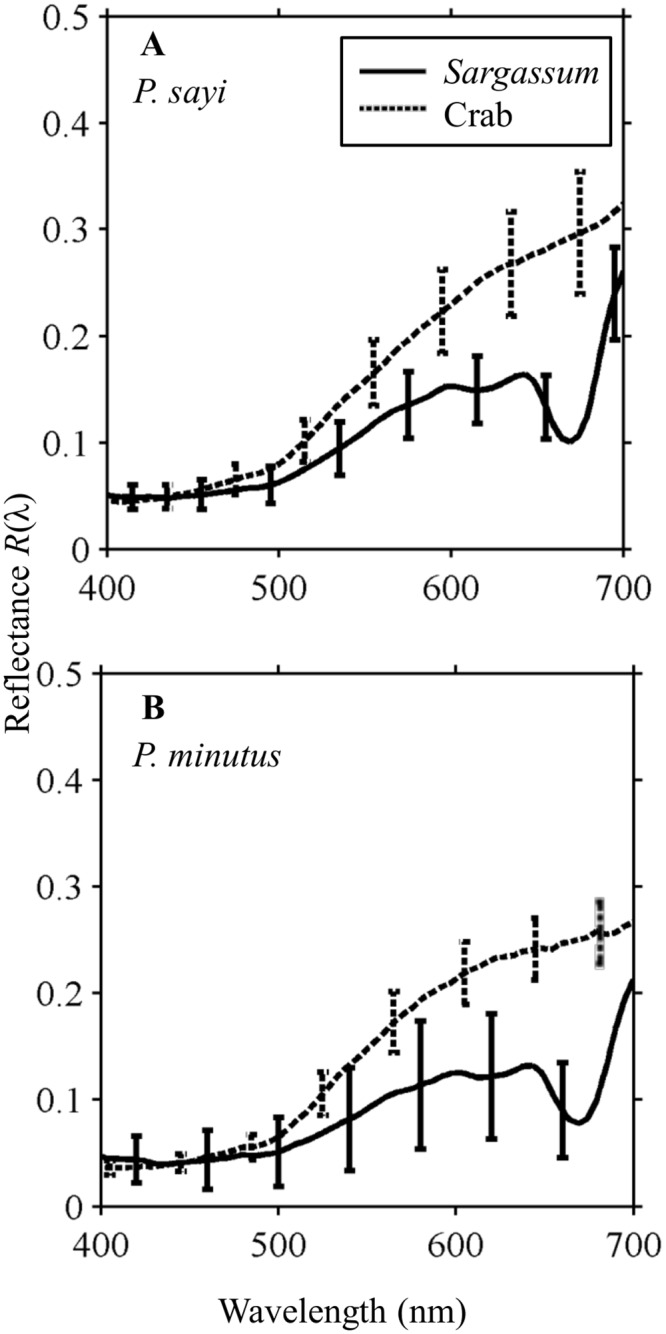
Fig 5. Mean and standard deviation of the measured reflectance spectra, R(λ), for a single randomly selected individual and its background obtained from a hyperspectral image of A) P. sayi and B) P. minutus.

The greatest difference for both species appears around the secondary chlorophyll absorption dip (675 nm) present in Sargassum reflectance, but not observed for the crabs. Variation in R(λ) across the carapace is lowest in the blue and increases towards the red.
