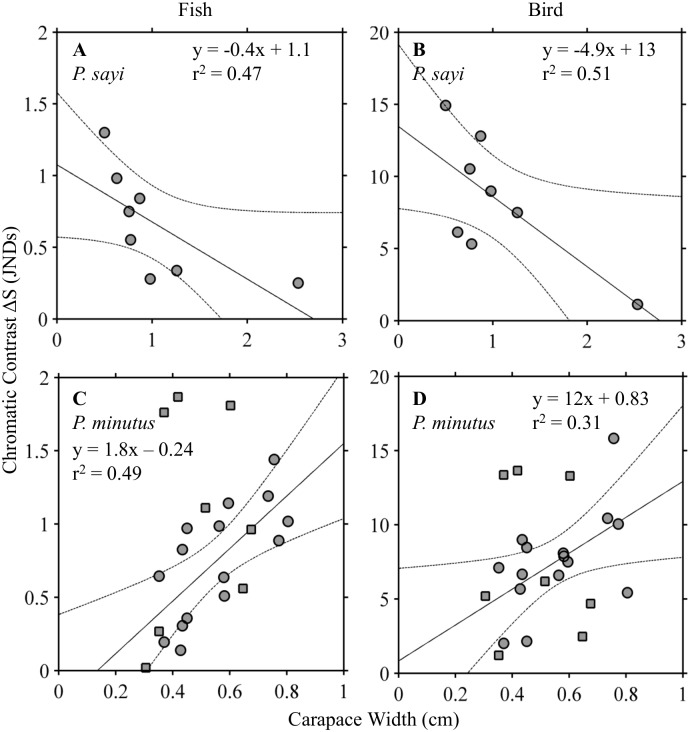
Fig 9. Chromatic contrast (ΔS) plotted against carapace width (CW) for each species under fish (left panels) and bird (right panels) visual models.
A linear regression model was fit to each group. ΔS showed a strong, significant (p = 0.05) negative correlation to CW for both models in P. sayi (A, B). For P.minutus (C, D), significant positive correlation to CW was observed for individuals without large white patches (circles). This correlation was not observed for individuals with white patches (squares), which have been superimposed on the figure and were not used in calculating the regression. Dotted lines represent 95% confidence interval.

