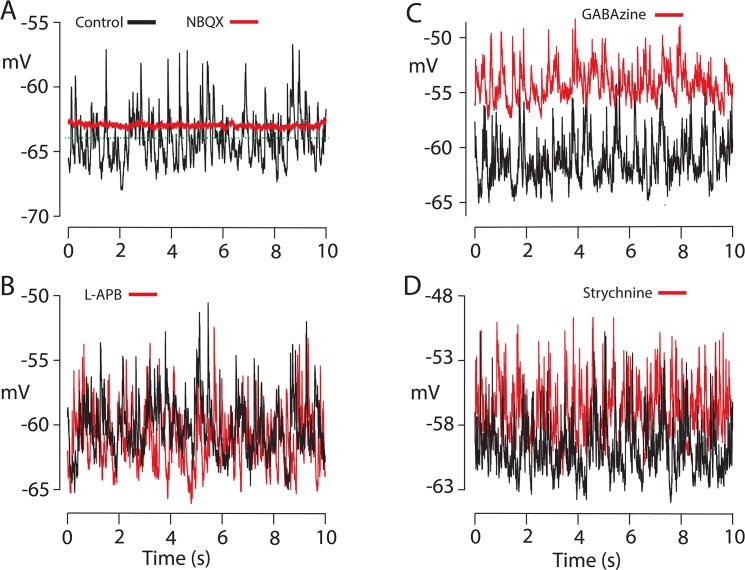
Fig 2. Spontaneous fluctuations in baseline voltage.
Baseline noise recorded from single cells in darkness in absence and presence of: A. 50 μM NBQX; control (black): StDev 1.26 mV, maximum peak-to-peak (max p-to-p) amplitude 10 mV, mean Vrest (dashed line) -64 mV. NBQX (red): StDev. 0.11 mV, max p-to-p amplitude 1.2 mV, mean Vrest - 62.8 mV. Mean change Vrest caused by NBQX:+1.16 mV +/- 0.85 mV SEM, n = 6 (range = +4.8 to -1.0 mV). B. 62.5 μM L-APB; control (black): StDev 1.45 mV, max p-to-p 13 mV, mean Vrest -58.3 mV. L-APB (red): StDev 1.49 mV, max p-to-p amplitude 13.9 mV, mean Vrest -58.5 mV. The mean change Vrest caused by L-APB +0.08 mV (n = 5). C. 40 μM GABAzine; control (black): StDev 1.20 mV, max p-to-p amplitude 10 mV, mean Vrest -60 mV. GABAzine (red): StDev 1.26 mV, max p-to-p amplitude 11 mV, mean Vrest -51.8 mV. The addition of TPMPA to the GABAzine containing solution did not reduce the RMS (StDev) noise level compared to the level in control. Mean change Vrest was 6.25 +/- 1.10 mV n = 5 (range of change in Vrest 8.5 to 3 mV). Both values were significantly different than no change in voltage (p = < 0.003). D. 2 μM strychnine; control (black): StDev 1.45 mV, max p-to-p amplitude 14 mV, mean Vrest -56 mV. Strychnine (red): StDev 1.58 mV, max p-to-p amplitude 14 mV, mean Vrest -54 mV. Mean change Vrest caused by strychnine was +1.17 mV (n = 6), not significantly different than 0 change in voltage.

