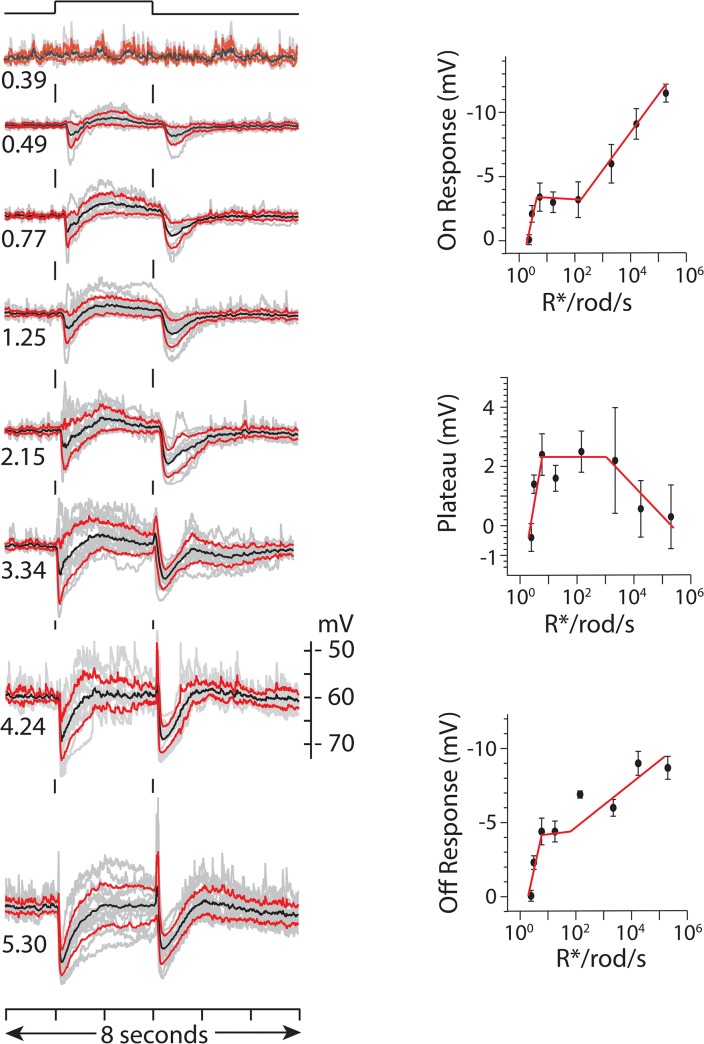
Fig 3. Response dependence on light intensity.
Left column of traces show the collected average response (black), +/- standard deviation (red) and individual responses (gray) evoked by 2 s full field flashes (720 μm dia.) 440 nm light at indicated intensities (log10 Rh*/rod/s) recorded (current clamp) in different cells. The number of cells (n) that contributed to average response at each intensity (log10 R*/rod/s) were: n = 8 @ 0.39; n = 17 @ 0.49; n = 9 @ 0.77; n = 17, 1.25; n = 12 @ 2.15; n = 15 @ 3.34; n = 12 @ 4.24, n = 16 @ 5.30. Baseline voltage was set to the mean resting potential across all cells in the data set, i.e. -59.95 +/- 0.79 mV (+/- SEM, n = 21) range - 53 to -68 mV. The mean amplitude +/- SEM of the peak response within 400 ms of light onset, the response plateau (taken as mean voltage over 0.8 and 1.2 s of the 2 s step) and the peak hyperpolarizing response within 400 ms of light offset are plotted against light intensity in the three graphs to the right of the column of responses.

