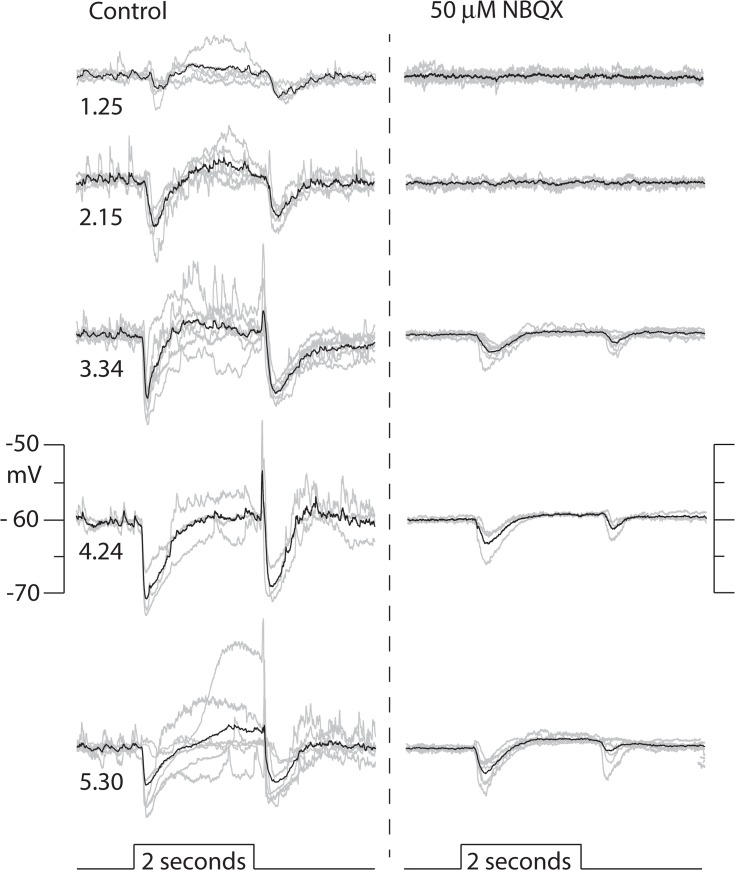
Fig 4. Effect of NBQX on responses to a range of light intensities.
Right and left columns of traces show responses evoked by 2s flashes of full field 440nm light at the indicated intensities (log10 Rh*/rod/s) in the absence and presence of 50 μM NBQX. Each panel shows the individual responses recorded from n different cells (gray traces) and the their average (black). Resting potentials ranged across cells from -53 to -67 mV (mean -59 +/- 1.92, n = 7) and were set to - 60 mV for comparisons. The number of cells included in the average response at each intensity were: 1.25, n = 6; 2.15, n = 5; 3.34, n = 7; 4.24, n = 3; 5.40, n = 7.

