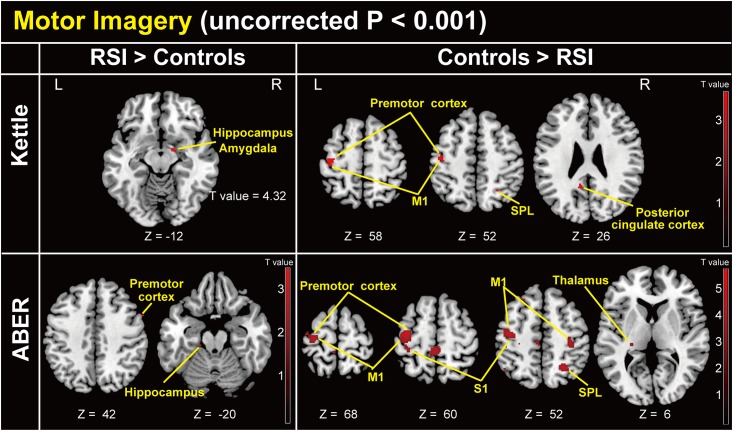
Fig 2. Group-level statistical parametric map showing the categorical comparison of hemodynamic changes in the motor imagery task (whole-brain uncorrected P < 0.001).
Upper left: Comparison of patients with RSI > controls in the kettle condition relative to the control condition. Upper right: Comparison of controls > patients with RSI in the kettle condition relative to the control condition. Lower left: Comparison of patients with RSI > controls in the ABER condition relative to the control condition. Lower right: Comparison of controls > patients with RSI in the ABER condition relative to the control condition. z (mm): z-coordinate in Montreal Neurological Institute (MNI) space, which is the basic brain template from the MNI. Plus and minus values indicate the dorsal and ventral directions, respectively. Red bar indicates a T value. M1: primary motor cortex, S1: primary somatosensory cortex, SPL: superior parietal lobule.

