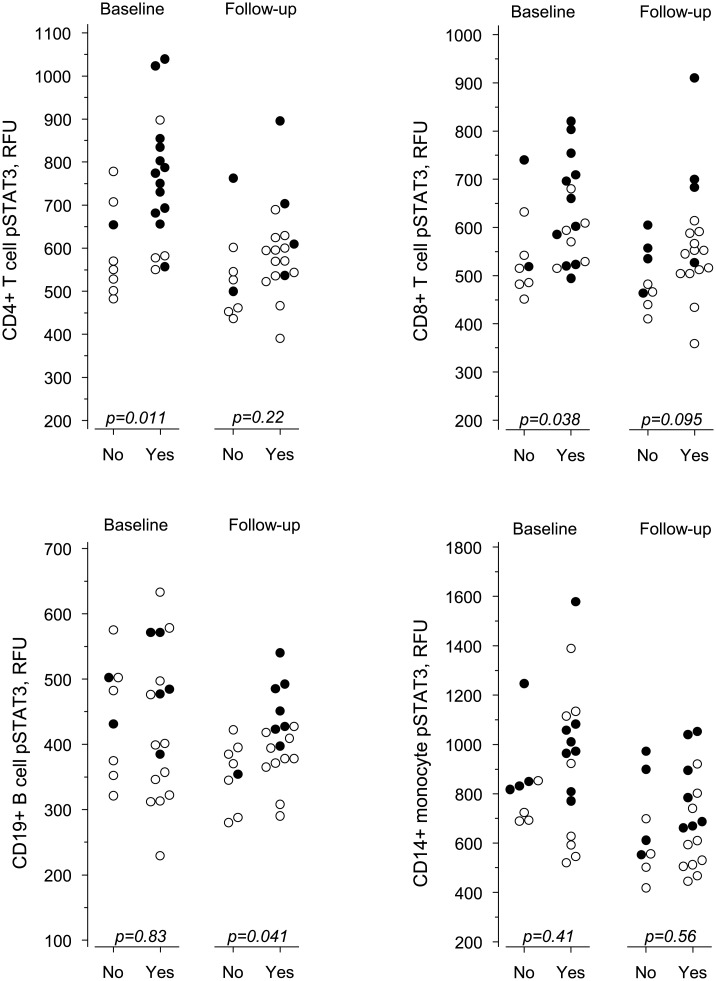
Fig 2. The pSTAT3 fluorescence intensity of lymphocyte subsets and monocytes at baseline and at follow-up according to EULAR treatment response.
Yes denotes good response, No denotes no or moderate response, and p values indicate significance between the two groups. Closed symbols denote pSTAT3+ patients and open symbols pSTAT3- patients.

