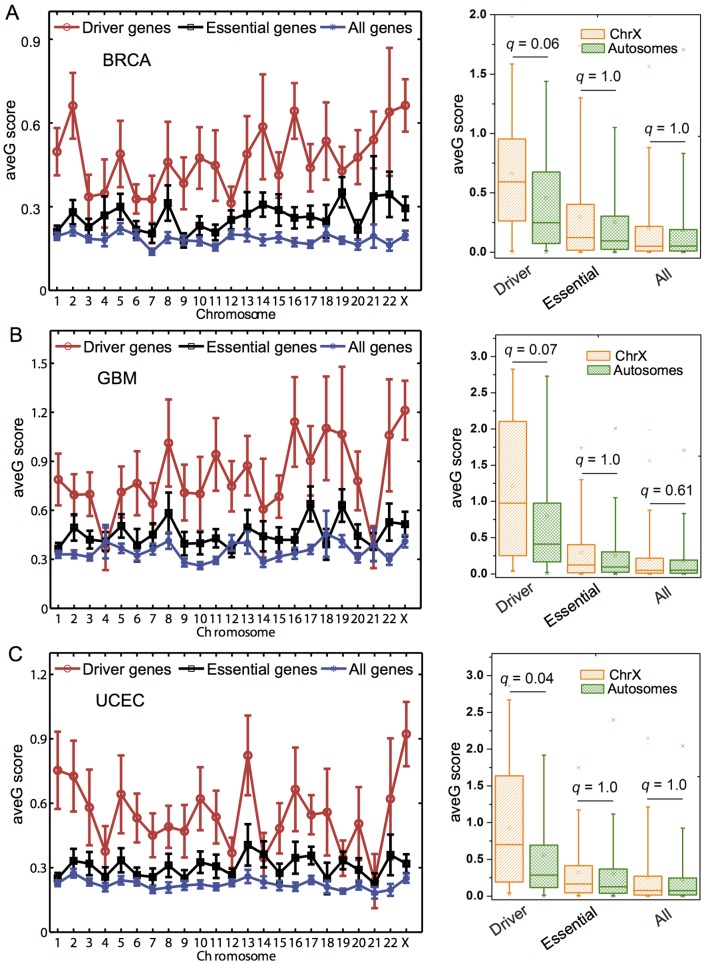
Fig 5. Distribution of average gravitation (aveG) score for cancer driver genes (Driver), essential genes (Essential), and all genes (All) across 23 human chromosomes in 3 cancer types.
The left plots show the distribution of aveG scores for three different genes across 23 human chromosomes in (A) BRCA: breast invasive carcinoma, (B) GBM: glioblastoma multiforme, and (C) UCEC: uterine corpus endometrial carcinoma. The right box plots show the comparison of aveG scores between the X chromosome (ChrX) and all the 22 autosomes (Autosomes) for three different gene sets in the corresponding left three cancer types. The p-values are calculated by the Wilcoxon rank-sum test and corrected by Benjamini-Hochberg multiple testing. The remaining 6 cancer types are provided in S17 Fig.

