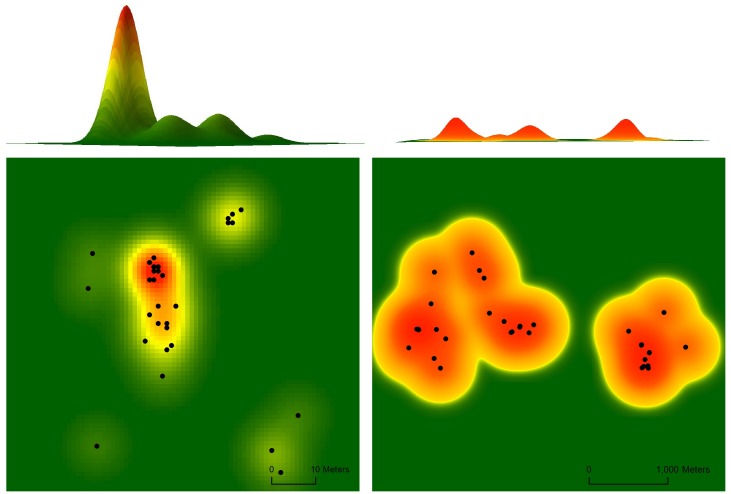
Fig 2. Example utilization distribution (spatial extent) and 95% kernel density estimate (height and coloration), as a metric of space-use intensity, for a control west (left two panels) and translocated (right two panels) tortoise monitored during the 2012 active season (approximately April through October).
The control west individuals exhibited greater space-use intensity than translocated tortoises, which is reflected in the higher peaks and more limited spatial extent associated with the control west tortoise’s utilization distribution.

