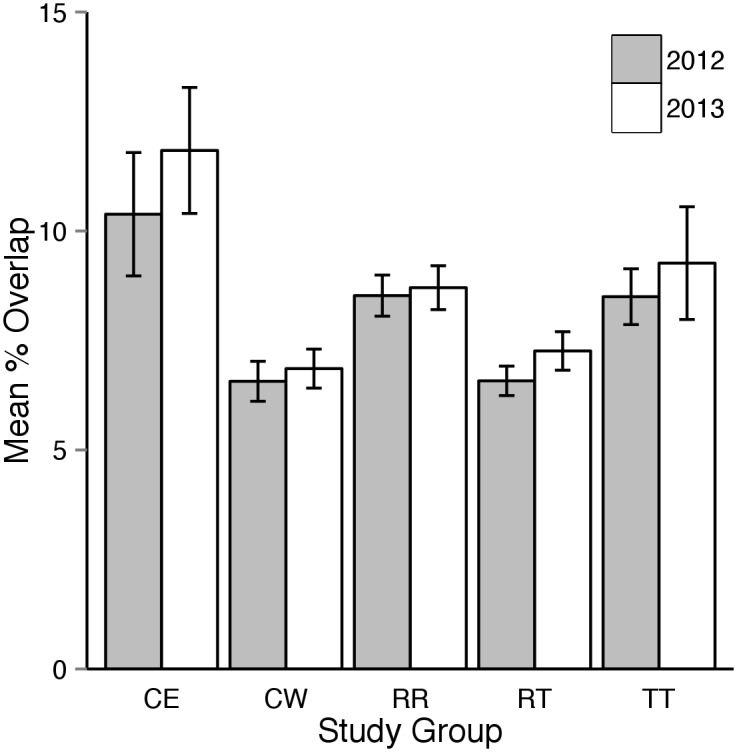
Fig 4. Estimates of mean percentage overlap of 95% utilization distributions between resident and translocated tortoises monitored during the 2012 (grey bars) and 2013 (white bars) active seasons (approximately April through October).

TT = overlap between tortoises in the translocated study group, RR = overlap between tortoises in the resident study group, and TR = overlap between tortoises in the translocated study group with those in the resident group. Note that overlap between translocated study group individuals was more than twice as great in 2012 compared to 2013.
