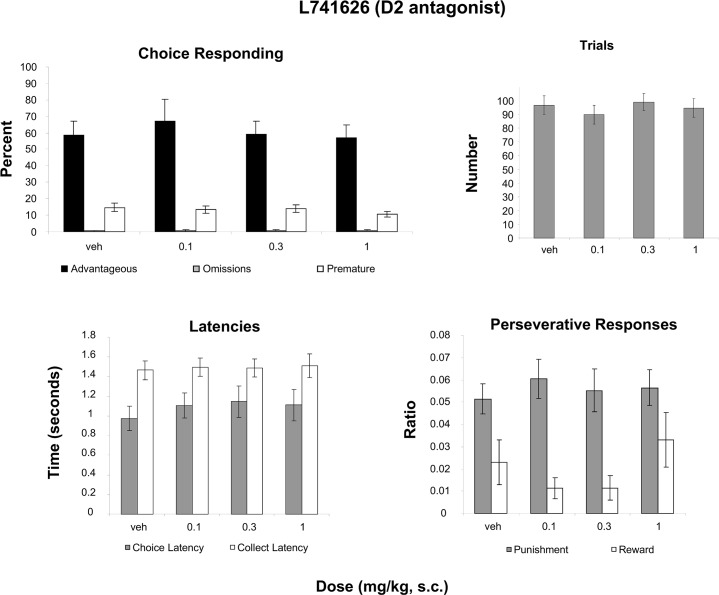
Fig 6. Effect of administration of a D2 antagonist on the rGT.
A: Mean ± SEM percent choice on the advantageous choice (dark bars), omissions (grey bars) and premature responses (open bars). B: Mean ± SEM number of trials initiated. C: Mean ± SEM latency to make a choice (grey bars) and latency to collect the food pellets (open bars). D: Ratio ± SEM perseverative responses for punished trials (grey bars) and rewarded trials (open bars). No significant differences were found for any analyses (n = 17).

