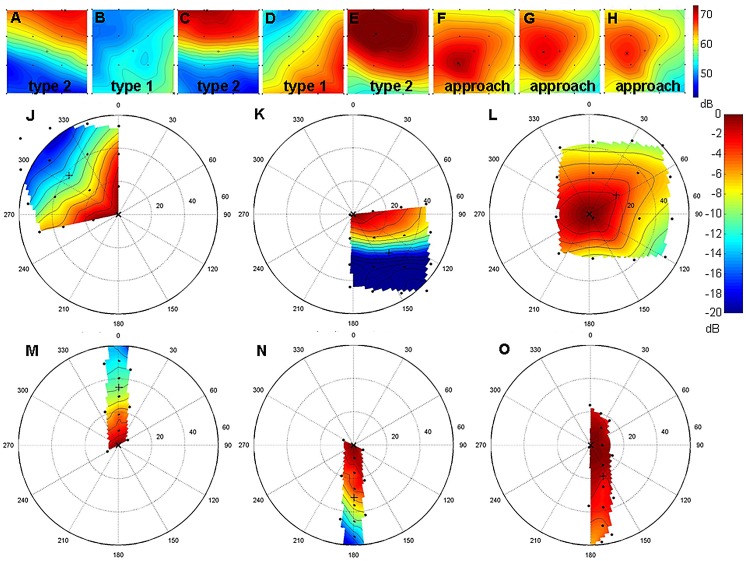
Fig 2. Sonar footprints and reconstructed sonar beams.
(A-H) Sonar footprints of type 2 (A,C,E), type 1 (B,D) and approach signals (F-H) of the call sequence depicted in Fig 1 on the square array. The SPL is color-coded and interpolated between the microphones (black dots) on the array plane. The black “+” represents the center of the array, the black “x” the calculated maximum. (J-O) Reconstructed sonar beams of signals recorded with the square array (J-L) and the chain array (M-O). The SPL is color-coded and indicates the beam shape relative to the beam maximum in the center of a polar plot. The black dots mark the positions of the microphones, the black “x” marks the calculated apparent or real beam maximum. Type 1 signals are depicted in (J) and (M), type 2 signals in (K) and (N), and approach signals in (L) and (O). Note that type 1 signals are directed to the lower part of the array whereas type 2 signals are directed to the upper part.

