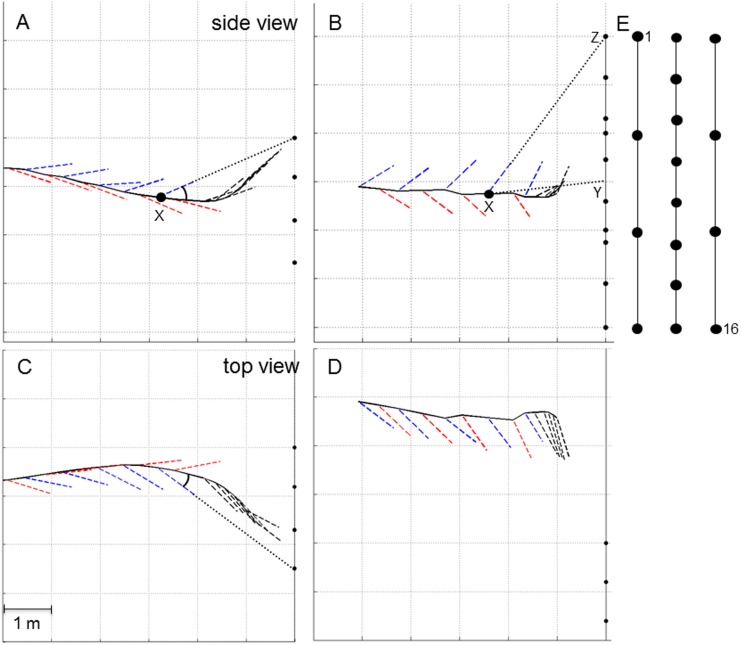
Fig 3. Changes in beam direction in exemplary flights towards the square and the chain array.
(A,B) depict side views and (C,D) overhead views of exemplary flights. The black dots represent the microphones in the array. The 4 m high square array was positioned ~1.6 m above ground (A,C) while the 6 m high chain array was positioned about 0.3 m above ground (B,D). The flight paths are depicted as black lines. At each position where a signal was emitted a vector pointing towards the calculated apparent beam maximum on the array indicates the apparent beam direction. The vectors of type 2 signals are depicted in blue and those of type 1 signals in red. Black vectors indicate the direction of approach signals. Note that in the flight depicted in (B,D), the bat passed on the left side of the chain array. Thus all horizontal beam directions are artifacts pointing to the right side whereas the bat might be facing straight ahead. However, the vertical angles remain unaffected by this offset. The vertical and horizontal angles between flight direction and apparent beam direction for each bat position (X) as shown in (A) and (C) are displayed in Fig 4. The vertical angle between the direction from the position of the bat (X) to the center of the microphone array (Y) and the apparent beam direction to the upper (Z) or lower end of the array as shown in (B) is displayed in Fig 5. (E) Front view scheme of the chain array with the first (1) and last microphone (16) labeled.

