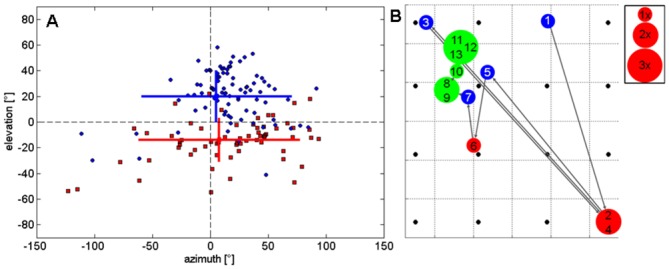
Fig 4. Separation of apparent beam directions of type 1 and type 2 signals.

(A) Based on 19 sequences containing 66 type 1 signals (red) and 88 type 2 signals (blue) of bats flying towards the square array, measured angles between the flight path and the calculated apparent beam vector in the vertical (elevation) and horizontal (azimuth) projection plane are depicted. Each of the displayed elevation or azimuth angles corresponds to the angle between the flight direction and the apparent beam direction at the corresponding position of the bat (X) as marked in Fig 3A and 3C. The colored bars indicate the respective means and standard deviations. Note the clear separation between signal types. The vectors of type 1 signals were positioned mainly below and those of type 2 signals mainly above flight direction. (B) Pulse-to-pulse path of the calculated apparent (when at the array edges) or real (when within the array plane) beam maxima of an exemplary flight on the square array plane with successive numbers showing their order. Type 1 signals are depicted in red, type 2 signals in blue, and approach signals in green. Circles are proportional to the number of calls pointed to this location. The black dots depict the 16 microphones.
