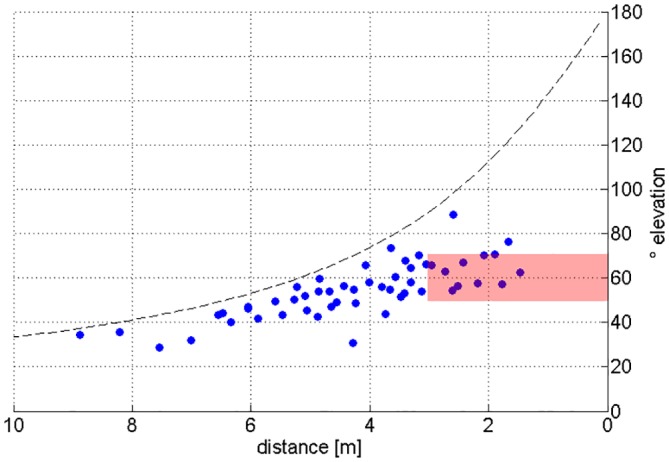
Fig 6. Apparent vertical angles between apparent call directions of type 1 and type 2 signals.

The apparent vertical angle between the signal types was determined as the sum of the vertical angle for each call type as measured between the direction from the bat to the center of the 6 m high chain array and the direction to the calculated apparent beam maximum (see Fig 5). The dashed line depicts the maximum angle between the upper and lower border of the array as seen from the bats position under the assumption that the bat is centered in front of the array. The values between 4–10 m to the array are limited by this maximal possible angle value. The red rectangle below 3 m marks a range where array height did not limit the measured angles.
