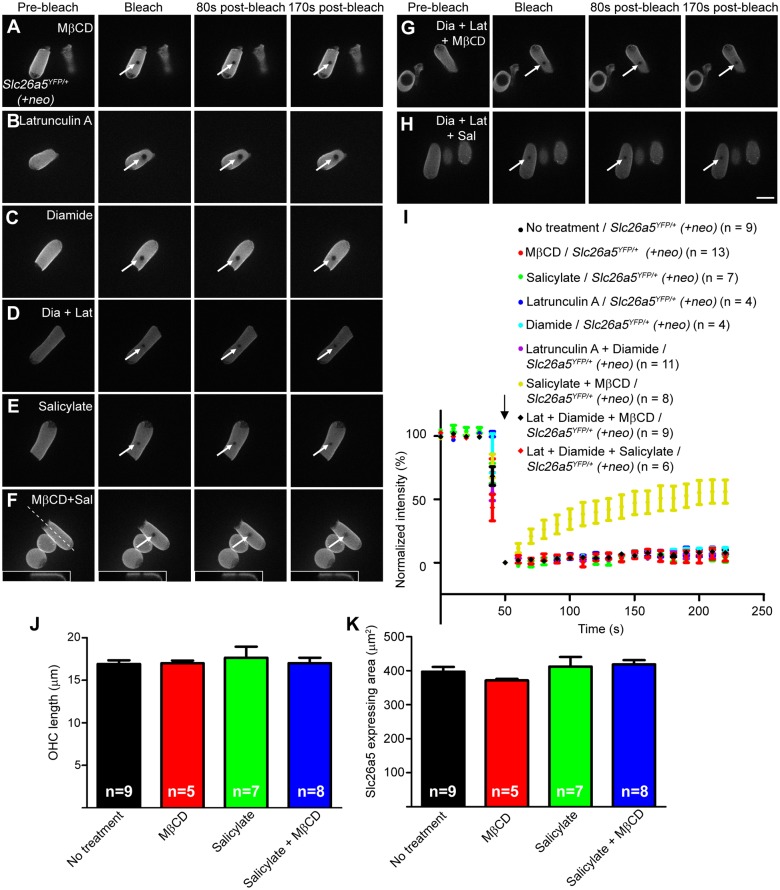
Fig 5. Slc26a5 mobility analysis in the lateral wall of isolated OHCs at P18-22.
FRAP examples for MβCD-treated (A), latruculin A-treated (B), diamide-treated (C), latrunculin A/ diamide-treated (D), salicylate-treated (E), MβCD/salicylate-treated (F), diamide/latrunculin A/MβCD-treated (G), diamide/latrunculin A/salicylate-treated (H) OHCs from Slc26a5 YFP/+ (+neo) mice are shown. Scale bar expresses 10 μm. The dashed line in (F) indicates the position of optical section shown in insets. (I) The normalized fluorescence recovery curves for images A-H are shown (see Materials and Methods). White arrows in A-H show bleached spots and the black arrow in I indicates the time of bleaching. Error bars express S.E.M. OHC length (J) and Slc26a5 expressing area (K) after each treatment is shown. Values are the mean ± SEM.

