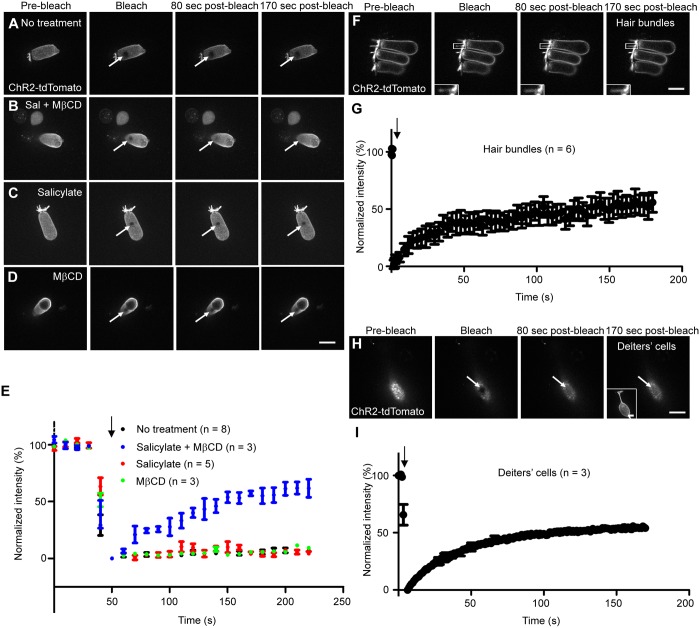
Fig 8. Mobility of ChR2-tdTomato in isolated OHCs and SCs at P18-22 using FRAP analysis.
(A-D) ChR2-tdTomato heterologously expressed OHCs are shown. Untreated (A), salicylate/MβCD-treated (B), salicylate-treated (C), and MβCD-treated (D) OHCs from Slc26a5-CreER T2+/-;ChR2-tdTomato f/+ mice after tamoxifen was intraperitoneally injected at P6-7 are shown. (E) The normalized fluorescence recovery curves for A-D are shown. (F) ChR2-tdTomato mobility in OHC hair bundles is shown and white-squared areas with hair bundles are shown in the insets. Initial ten data points for ChR2-tdTomato were taken at 0.248 second intervals and the rest of 60 data points were taken at 3 second intervals. (G) The normalized fluorescence recovery curve as for image F is shown. (H) ChR2-tdTomato mobility in Deiters’ cell PM is shown. The inset shows the cell after FRAP obtained by maximum intensity projection of z-stack. Deiters’ cells were isolated from FgfR3-iCreER T2+/-;ChR2-tdTomato f/+ mice intraperitoneally injected with tamoxifen at P6 and P7 (see Materials and Methods). Each data point was taken at 0.843 second intervals. (I) The normalized fluorescence recovery curve as for image H is shown. Values are the mean ± S.E.M. Scale bars express 10 μm. White arrows (A-D, F, and H) show bleached spots and black arrows indicate the time of bleaching. Numbers (n) of cells analyzed in more than three mice are shown.

